Shopify Store Doing $50K/Month but No Cash Left? Here Is Exactly Why
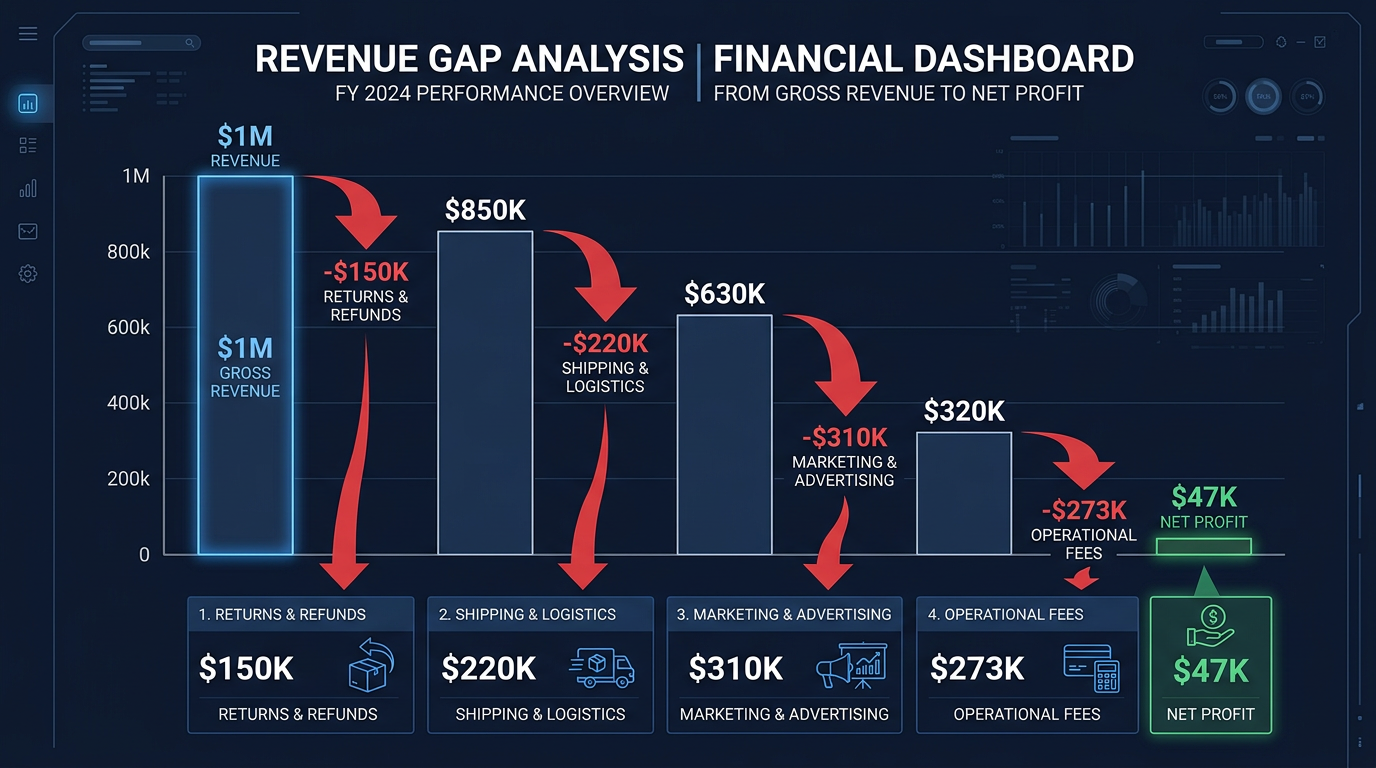
You sold $50K this month. Your bank account disagrees. Let me walk you through the exact math of where your cash actually went -- and how to keep more of it.
Nguyen Tuan Dai
Founder & CEO, Okiela
Key Takeaways
- 1A $50K/month Shopify store typically keeps $3K-$6K in actual cash
- 2Cash flow timing makes it feel even worse -- inventory paid weeks before revenue arrives
- 3Most founders understate COGS by 15-19% by missing freight, duties, and packaging
- 4Shipping gap alone can cost $2,000-$3,000/month on a $50K store
- 515-20% of your product catalog is likely losing money on every sale
Table of Contents (5 sections)
I hear this almost every week from Shopify founders:
"I did $50K in sales this month. Where did the money go?"
It is not a dumb question. It is THE question. And the answer usually surprises people, because the money did not "go" anywhere mysterious. It went to very specific places -- you just could not see them all at once.
Let me show you exactly where $50K goes in a real Shopify store. I will use numbers I see constantly across founders doing $30K-$100K/month.
The $50K Breakdown: Where Every Dollar Went
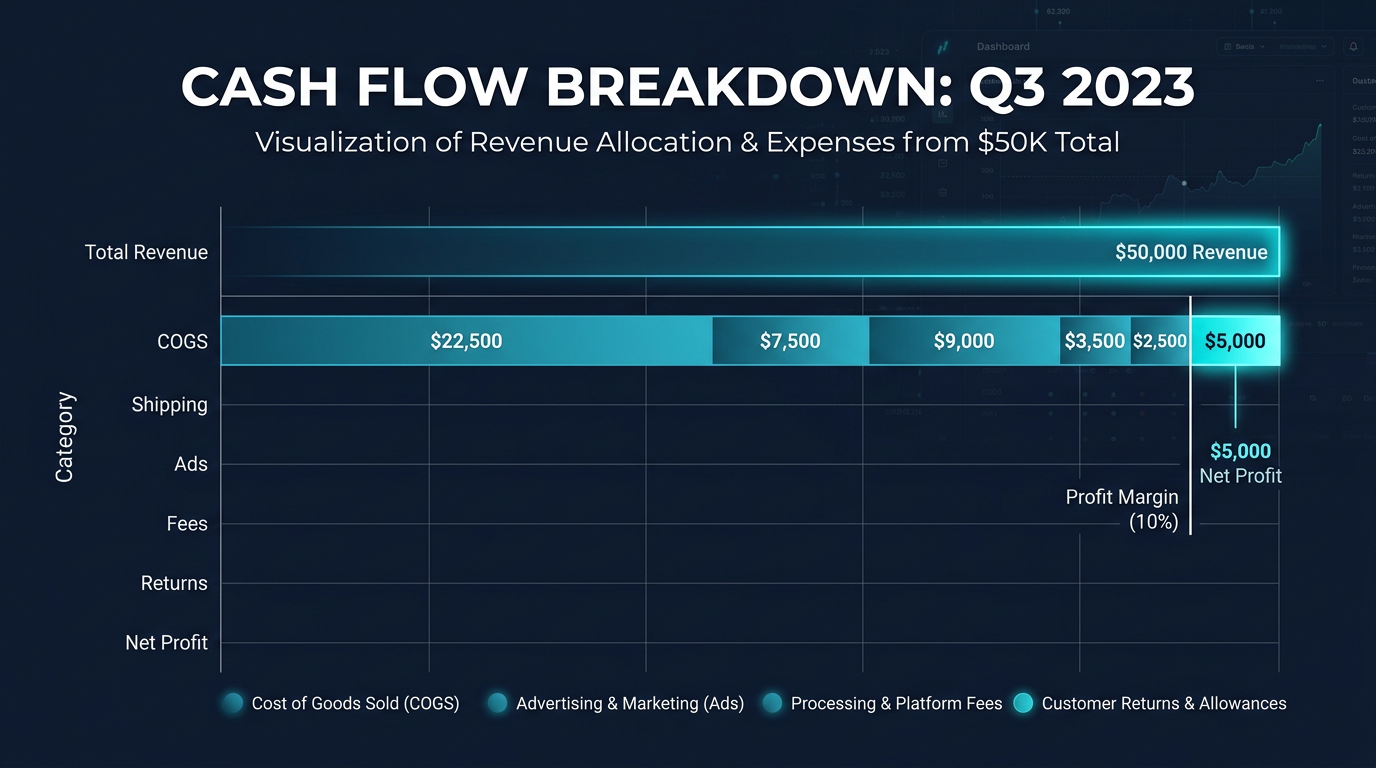
You sold $50,000 this month. Nice. Let us trace every dollar.
Line 1: Cost of Goods Sold -- $20,000 (40%)
Your products cost money to make or buy. For most DTC brands, COGS runs 35-50% of revenue. I will use 40% as a realistic middle ground.
But here is where founders often get it wrong: they calculate COGS as just the product purchase price. Real COGS includes the product itself, freight from manufacturer to your warehouse, import duties and tariffs, packaging materials, and quality control rejects or damaged units.
If you are using $8.00 as your unit cost but the ACTUAL landed cost is $9.50, you are understating COGS by 19% across your entire catalog.
$50,000 x 40% = $20,000 gone. You have $30,000 left.
Line 2: Shipping Costs -- $6,250 (12.5%)
Even if you charge for shipping, the gap between what you charge and what carriers charge is usually negative. And if you offer free shipping on orders above a certain threshold, a big chunk of your orders eat the full shipping cost.
Typical breakdown for a $50K month:
- Shipping revenue collected from customers: $3,500
- Actual carrier costs: $6,250
- Net shipping loss: -$2,750
That $2,750 disappears from your bank account every month and Shopify never flags it.
$30,000 - $6,250 = $23,750 left.
Line 3: Ad Spend -- $7,500 (15%)
You are running Meta Ads, maybe Google Shopping, maybe TikTok. The industry average ad-to-revenue ratio for DTC brands is 15-25%.
At 15%, that is $7,500/month going to Meta and Google. Some months more, some months less. But it goes out before you can count it as profit.
$23,750 - $7,500 = $16,250 left.
Line 4: Payment Processing -- $1,750 (3.5%)
Shopify Payments at 2.9% + $0.30 per transaction, plus occasional PayPal or alternative gateway surcharges.
On 600 orders at $83 average: roughly $1,750/month.
$16,250 - $1,750 = $14,500 left.
Line 5: Returns and Refunds -- $3,000 (6%)
Your return rate is 8-12%. Each return costs you the refunded amount PLUS processing costs (return label, restocking, customer service time, sometimes inventory write-off).
Conservative estimate: $3,000/month in total return-related costs.
$14,500 - $3,000 = $11,500 left.
Line 6: Shopify Plan + Apps -- $600 (1.2%)
Shopify plan ($105) plus 6-8 apps ($400-500 total). Let us say $600/month.
$11,500 - $600 = $10,900 left.
Line 7: Team / Freelancer Costs -- $3,000 (6%)
Even a "solo" founder usually has some help: a VA ($500-$1,000), a freelance designer ($500), maybe a part-time customer service person ($1,000-$2,000). Or maybe you are paying yourself (you should be).
$10,900 - $3,000 = $7,900 left.
Line 8: Taxes -- $2,000 (4%)
Sales tax you collected but need to remit. Income tax set-aside. Depending on your structure, this varies, but setting aside 25-30% of actual profit for taxes is prudent.
$7,900 - $2,000 = $5,900 left.
The Final Number
Out of $50,000 in revenue, you have $5,900 left. That is an 11.8% true margin.
And honestly? $5,900 is on the HEALTHY side. Many stores doing $50K/month are closer to $2,000-$3,000 in actual take-home cash. Some are negative.
| Line Item | Amount | % of Revenue |
|---|---|---|
| Revenue | $50,000 | 100% |
| COGS | -$20,000 | 40.0% |
| Shipping | -$6,250 | 12.5% |
| Ad Spend | -$7,500 | 15.0% |
| Payment Processing | -$1,750 | 3.5% |
| Returns + Refunds | -$3,000 | 6.0% |
| Shopify + Apps | -$600 | 1.2% |
| Team / Freelancers | -$3,000 | 6.0% |
| Taxes (set-aside) | -$2,000 | 4.0% |
| Cash Left | $5,900 | 11.8% |
Why It Feels Worse Than It Is
The numbers above assume everything goes perfectly. But in reality:
Cash flow timing kills you. You paid for inventory 30-60 days before those sales happened. Your ad spend is charged on the 1st but revenue trickles in over 30 days. Shopify pays out every 2-3 business days, but your supplier invoice was due last week.
So even with $5,900 in "profit" this month, your bank account might show $800 because last month's inventory bill just hit.
Seasonality compounds the problem. You stocked up for a big month. The big month happened ($50K!). But you bought $25K in inventory to make it happen, and you will not sell through all of it until next month. Your cash is sitting on shelves, not in your account.
5 Things You Can Do This Week
1. Calculate Your True Per-Order Profit
Not revenue per order. Not gross margin per order. TRUE profit per order after ALL costs.
Formula: (Revenue - COGS - Shipping - Payment Fee - Allocated Ad Spend - Allocated Returns Cost) / Number of Orders
If this number is below $8-10 per order, you have a structural problem that more sales will not fix.
2. Find Your Cash-Burning SKUs
Upload your last 3 months of data to Okiela. The AI identifies which specific products are losing money after all costs. Most stores find 15-20% of their catalog is underwater.
Kill those SKUs or reprice them. This single move can add 5-10% to your overall margin.
3. Audit Your App Stack
Open your Shopify admin. Go to Settings, then Apps. Look at every single app and its monthly cost. If you have not opened an app in 30 days, uninstall it. I have seen founders save $200-$400/month just from this 15-minute exercise.
4. Renegotiate Shipping Rates
If you ship 500+ packages per month, you have leverage. Call your carrier and ask for volume discounts. Switch to a shipping aggregator that negotiates rates across carriers. Even $0.50 per package saved is $250/month.
5. Set Up a Weekly Cash Review
Every Monday morning, spend 15 minutes looking at three numbers:
- Bank account balance (reality)
- Revenue this week (top line)
- Estimated profit this week (what you actually keep)
Okiela generates this for you automatically. But even a simple spreadsheet is better than nothing.
The Mindset Shift
Revenue is not your money. It is everyone else's money flowing through your store. COGS goes to your supplier. Payment fees go to Shopify and Stripe. Shipping goes to UPS and FedEx. Ad spend goes to Meta and Google.
What is left after all of them take their cut? THAT is your money.
Once you see it that way, you stop celebrating revenue milestones and start celebrating profit milestones instead.
$50K in sales is not the goal. $5,000+ in your pocket at the end of the month -- that is the goal.
Upload your Shopify export to Okiela and see your real cash flow in 30 seconds. The free plan includes 3 analyses per month. Sometimes the truth hurts. But it is always better than guessing.
Find the hidden profit leaks draining your store.
Send one order export. Get your 3 biggest profit leaks back within 48 hours.
Request a free Profit Leakage AuditFree, founder-run, no pitch unless you ask. Every number labeled Verified or Estimated. Remove customer PII before upload.
Enjoyed this article?
Get weekly profit optimization tips and Okiela product news delivered to your inbox.
No spam. Unsubscribe anytime.
Nguyen Tuan Dai
Founder & CEO, Okiela
FP&A analyst building ecommerce tools on the side. Helping founders see their real numbers since 2025.