Why Your Shopify Revenue Is Up but Profit Is Down (The $953K Gap Explained)
Your Shopify dashboard says $1M revenue. Your bank account says $47K. Here is where the other $953K went -- and what to do about it, step by step.
Nguyen Tuan Dai
Founder & CEO, Okiela
Key Takeaways
- 1A $1M revenue store typically keeps only $47K-$146K in actual profit
- 27 cost categories leak money before it reaches your bank: returns, COGS, payment fees, shipping, ads, platform fees, tariffs
- 3Most Shopify founders overestimate profit by 15-30%
- 4CAC has risen 233% over the past decade to $78-82 per customer
- 515-20% of your product catalog is likely losing money on every sale
Table of Contents (6 sections)
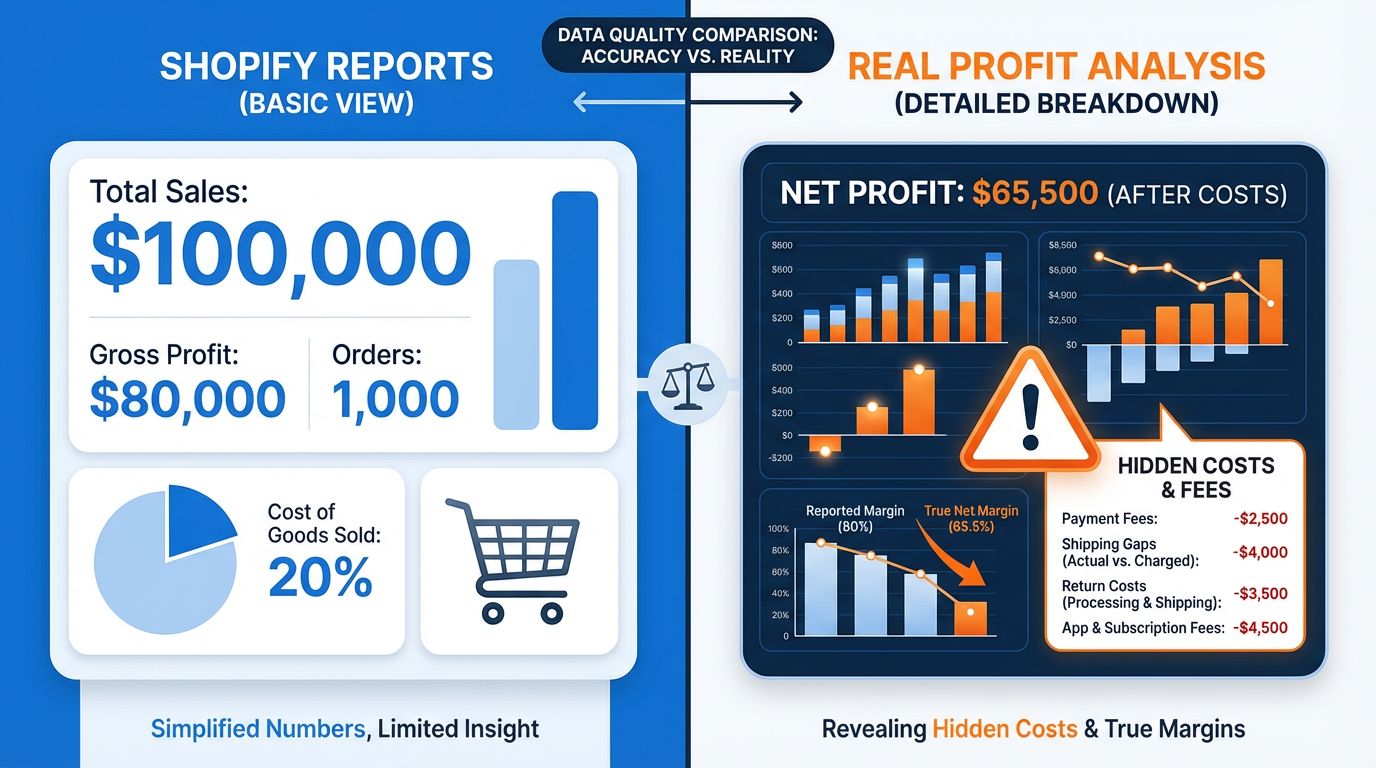
A founder I know hit $100K in Shopify sales last month. He posted the screenshot on Twitter. Got 200 likes.
Then he checked his bank account. $3,200 left.
Not a typo. $100K in revenue, $3,200 in actual cash. He called me at 11pm asking what went wrong.
Nothing went "wrong" exactly. He just had no idea where the other $96,800 was going. And honestly? Most Shopify founders are in the same boat. They just have not done the math yet.
Let me walk you through it -- same way I walked him through it.
The Revenue Illusion
Here is what Shopify shows you: a beautiful upward revenue graph. Sales this month. Sales last month. Maybe a nice green arrow.
Here is what Shopify does NOT show you: where that money actually goes before it reaches your pocket.
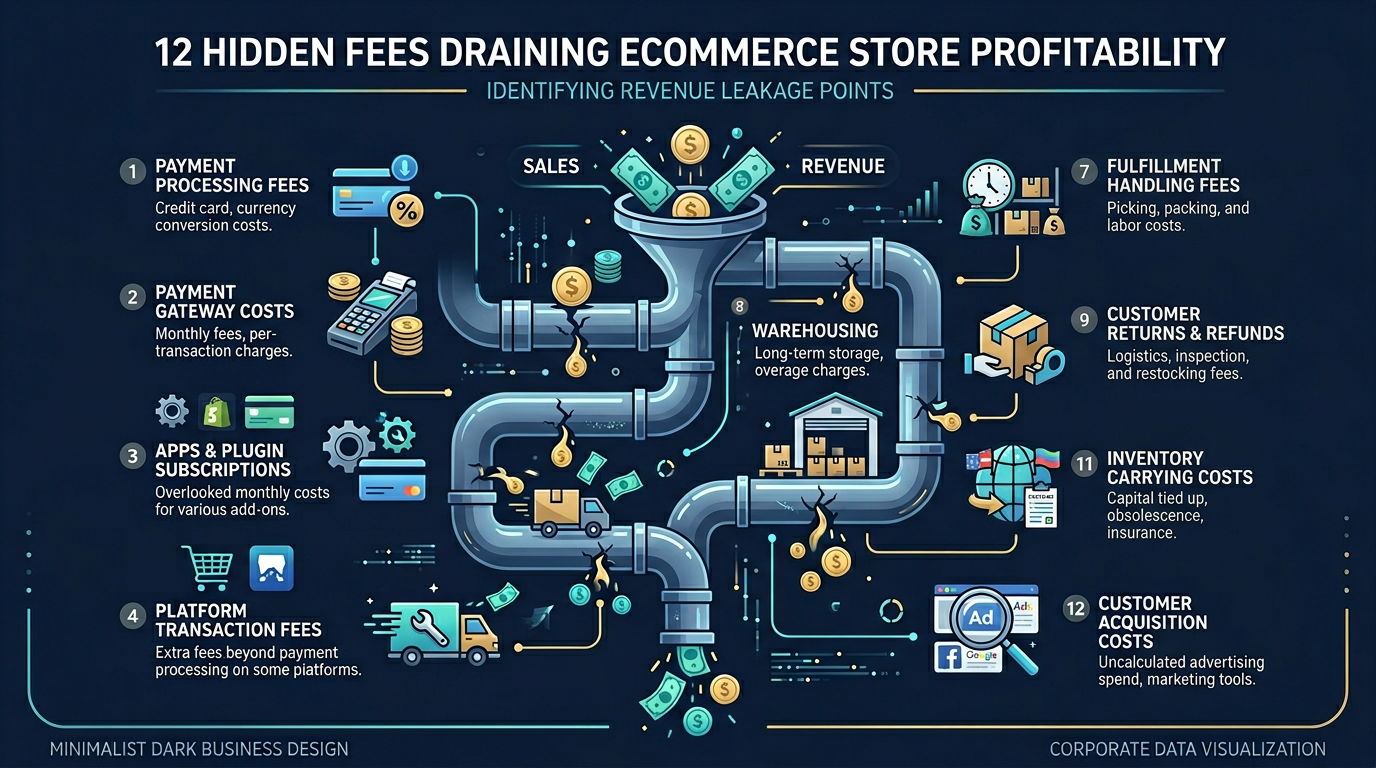
Think of it like this. Your store is a pipe. Revenue flows in at the top. But there are 7 holes in that pipe, and money leaks out of every single one before anything drips into your bank account.
Most founders only know about 2 or 3 of those holes.
The 7 Holes in Your Revenue Pipe
Let me use real numbers. Say your store does $1M per year in gross revenue. Here is where that million actually goes:
Hole 1: Returns and Refunds ($80K-$120K)
Average ecommerce return rate is 20-30% for apparel, 8-15% for everything else. But here is what most founders miss: a return does not just cost you the sale. It costs you the return shipping label ($6-12), restocking labor ($3-8), inventory depreciation, and customer service time. The original payment processing fee? The gateway keeps that too.
On $1M revenue with a 10% return rate, you are looking at $100K+ in total return-related costs.
Hole 2: COGS That Are Actually Higher Than You Think ($400K-$500K)
You know your landed product cost. But do you know your ACTUAL landed cost? That includes freight from manufacturer to warehouse, duties and tariffs (which changed significantly in 2026), packaging, quality control rejects, and dead inventory you will eventually write off.
Most brands underestimate their true COGS by 8-15%. On $1M, that is an $80K-$150K surprise.
Hole 3: Payment Processing ($29K-$35K)
Shopify Payments takes 2.9% + $0.30 per transaction. Third-party gateways often charge more. Shop Pay Installments? That is 5.9%.
On $1M revenue, you are paying roughly $30K just for the privilege of accepting money. Shopify does not subtract this from your "profit" anywhere in the dashboard.
Hole 4: Shipping You Absorb ($100K-$150K)
You charge $5.99 for shipping. Your actual carrier cost is $8.50. That $2.51 gap is pure margin erosion.
And if you offer free shipping over $75? Every order above that threshold just ate the full shipping cost. On 1,000 monthly orders, the shipping gap alone is $2,500/month or $30K/year. For higher-volume stores, it is $100K+ easily.
Hole 5: Ad Spend ($200K-$300K)
Here is the ugly truth about paid acquisition in 2026: Customer Acquisition Cost has risen 233% over the past decade. The average DTC CAC is now $78-82 per customer.
If you spend $250K on ads and get 3,200 customers, your CAC is $78 per customer. That is real money subtracted from every order before you see a dime of profit.
Hole 6: Platform and App Fees ($25K-$40K)
Your Shopify plan: $79-399/month. Klaviyo: $35-150. Reviews app: $15-50. SEO tool, shipping app, customer support tool, analytics -- the average store runs 6-8 apps at $10-50/month each.
That quietly adds up to $2,000-3,000/month, or $24K-36K/year. None of this shows up in your per-product profitability.
Hole 7: Tariffs and Import Duties ($20K-$50K)
This is the 2026 wildcard. The de minimis exemption is gone. New import surcharges of 10-25% on certain product categories mean your COGS just jumped -- and if you have not recalculated your pricing, you are selling at a loss on some SKUs without knowing it.
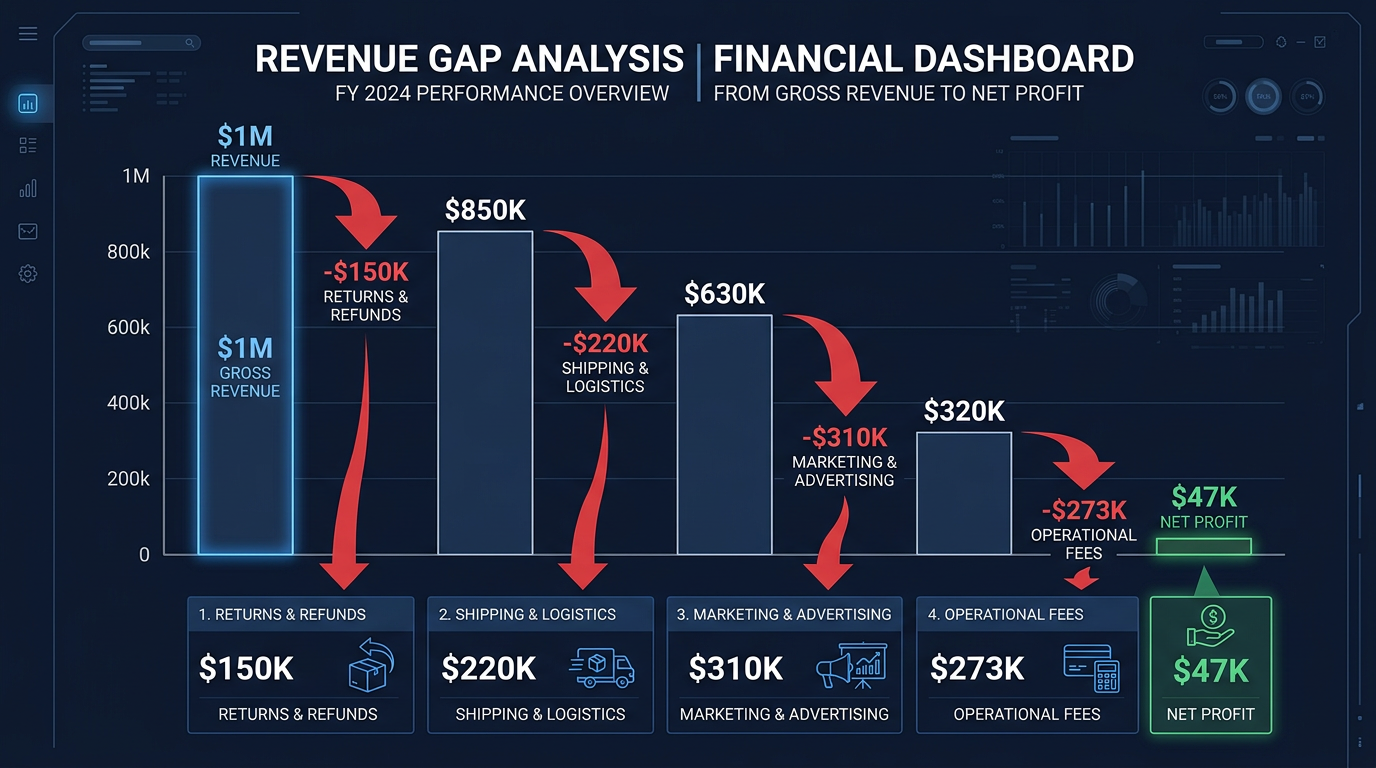
The Real Math
Add it all up for a $1M/year store:
| Cost Category | Low Estimate | High Estimate |
|---|---|---|
| Returns + Refunds | $80,000 | $120,000 |
| True COGS | $400,000 | $500,000 |
| Payment Processing | $29,000 | $35,000 |
| Shipping Gap | $100,000 | $150,000 |
| Ad Spend | $200,000 | $300,000 |
| Platform + Apps | $25,000 | $40,000 |
| Tariffs + Duties | $20,000 | $50,000 |
| Total Costs | $854,000 | $1,195,000 |
| Actual Profit | -$195,000 | $146,000 |
Best case: you keep $146K (14.6% margin). Worst case: you are literally losing money. Most stores land somewhere around $47K-$80K -- a 4.7% to 8% true profit margin.
That is the $953K gap.
Why This Matters Right Now
CAC rose 22% in the last year alone. Tariffs changed overnight. Return rates are climbing. Payment fees are not going down.
If you are still looking at your Shopify revenue graph and feeling good, you are making decisions with incomplete data. And incomplete data leads to bad decisions -- like scaling ad spend on a SKU that is secretly losing money on every order.
What You Can Do This Week
Step 1: Export Your Last 3 Months of Data
Go to Shopify Admin, then Analytics, then Reports. Export your "Orders" report as CSV. This gives you the raw data you need.
Step 2: Calculate Your Real Numbers
You can do this in a spreadsheet (takes 3-6 hours) or upload to Okiela (takes 30 seconds). Either way, you need to subtract ALL 7 cost categories from your revenue -- not just COGS.
Step 3: Find Your Profit-Killing SKUs
Here is what usually happens: founders discover that 15-20% of their product catalog is actively losing money. The "best seller" with the highest revenue often has one of the lowest margins once you factor in ad spend, returns, and shipping.
Kill the losers. Double down on the winners. That single move can improve your overall margin by 5-10 percentage points.
Step 4: Set Up Weekly Tracking
Profit is not a once-a-year calculation. Markets move, costs change, and what was profitable in January might be bleeding cash by March. You need a weekly habit of checking your real numbers.
The Bottom Line
Revenue is vanity. Profit is sanity. And your bank account is reality.
If your revenue is going up but your profit is not following, you do not have a growth problem. You have a visibility problem. You cannot fix what you cannot see.
The free plan on Okiela includes 3 analyses per month. Upload your Shopify export, see your real profit waterfall in 30 seconds, and find out exactly where your money is going. No credit card needed.
Find the hidden profit leaks draining your store.
Send one order export. Get your 3 biggest profit leaks back within 48 hours.
Request a free Profit Leakage AuditFree, founder-run, no pitch unless you ask. Every number labeled Verified or Estimated. Remove customer PII before upload.
Enjoyed this article?
Get weekly profit optimization tips and Okiela product news delivered to your inbox.
No spam. Unsubscribe anytime.
Nguyen Tuan Dai
Founder & CEO, Okiela
FP&A analyst building ecommerce tools on the side. Helping founders see their real numbers since 2025.