Why Your Shopify Reports Do Not Match Reality (5 Hidden Cost Gaps)
Shopify shows 60% gross margin but your bank account says otherwise. Here are the 5 specific cost gaps Shopify does not track, with real numbers.
Nguyen Tuan Dai
Founder & CEO, Okiela
Key Takeaways
- 1There is a consistent 15-30% gap between Shopify reported profit and reality
- 25 cost gaps: payment fees, shipping gaps, returns, platform fees, and CAC
- 3A $45K/month store had $12,800/month in untracked costs
- 4Payment processing alone costs $21K/year for a $600K revenue store
- 5Okiela closes all 5 gaps automatically with the 5D Pipeline
Table of Contents (8 sections)
If you have ever looked at your Shopify analytics and thought "I should be making more money than this," you are not alone.
Based on industry benchmarks and our analysis, there is a consistent 15-30% gap between what Shopify reports as profit and what actually lands in the founder's bank account.
This is not a Shopify bug. It is a fundamental limitation of how e-commerce platforms track costs.
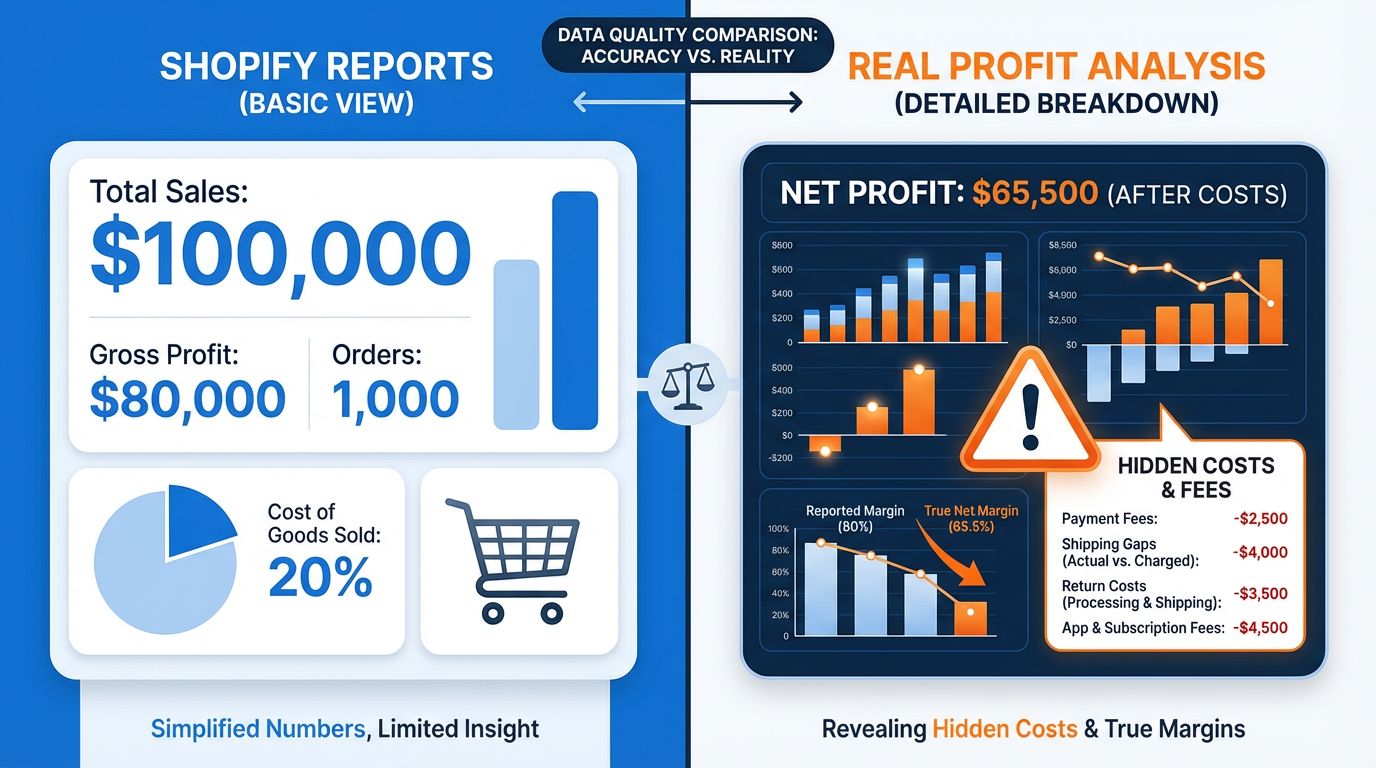
The Reporting Gap: What Shopify Shows vs. Reality
Shopify shows you gross revenue and basic gross profit (revenue minus COGS). But it was designed as a selling platform, not a financial analysis tool.
Here are the 5 specific cost categories that fall through the cracks:
Gap 1: Payment Processing Fees
Every transaction through Shopify Payments costs 2.9% + $0.30. With third-party payment providers, it is often 3.2-3.5% + $0.30.
Real impact for a typical store:
| Monthly Orders | Avg Order Value | Monthly Payment Fees | Annual Impact |
|---|---|---|---|
| 500 | $45 | $803 | $9,630 |
| 1,000 | $50 | $1,750 | $21,000 |
| 2,500 | $55 | $4,263 | $51,150 |
| 5,000 | $60 | $9,000 | $108,000 |
For a store doing $600K/year in revenue, payment fees alone eat $21K -- roughly 3.5% of revenue that never appears in Shopify's profit calculation.
Gap 2: Shipping Cost vs. Charged Amount
You set shipping rates based on what feels competitive. But the actual carrier cost is often higher than what you charge.
Common scenario:
- You charge customers: $5.99 flat rate
- Actual UPS/USPS/FedEx cost: $8.50 average
- Gap per order: -$2.51
- Monthly impact at 1,000 orders: -$2,510
Shopify records the shipping revenue you charged but does not subtract your actual shipping expense at the product level.
Gap 3: Return and Refund Costs
The National Retail Federation reports average e-commerce return rates of:
- Apparel: 24-30%
- Electronics: 11-15%
- Home goods: 8-12%
- Beauty: 5-8%
Each return has stacking costs that Shopify does not aggregate:
- 1Return shipping label: $6-12 (you often pay this)
- 2Restocking labor: $3-8 per item
- 3Inventory depreciation: 10-50% of item value (damaged, opened, seasonal)
- 4Customer service handling: $2-5 per interaction
- 5Refund processing: payment provider keeps the original fee
A 20% return rate on $50 products can cost $8-15 per returned unit. On 1,000 monthly orders, that is $1,600-3,000/month in hidden costs.
Gap 4: Platform and App Subscription Fees
The average Shopify store runs 6-8 apps. Here is a typical monthly stack:
| App Category | Typical Monthly Cost |
|---|---|
| Shopify plan | $79-399 |
| Email marketing (Klaviyo/Omnisend) | $35-150 |
| Reviews (Judge.me/Loox) | $15-50 |
| SEO/Analytics | $20-80 |
| Shipping/Fulfillment | $25-100 |
| Customer support (Gorgias/Zendesk) | $50-200 |
| Total Monthly | $224-979 |
That is $2,700-11,750/year in platform costs that are not reflected in product-level profitability reporting.
Gap 5: Customer Acquisition Costs
Your ad spend is the biggest hidden cost of all. Shopify does not know what you spend on Facebook Ads, Google Ads, influencer deals, or affiliate commissions.
Average CAC by channel (2025 benchmark data):
| Channel | Avg CAC (DTC) |
|---|---|
| Meta/Facebook Ads | $25-45 |
| Google Shopping | $15-35 |
| TikTok Ads | $10-25 |
| Influencer Marketing | $20-60 |
| Organic/SEO | $5-15 (over time) |
If your blended CAC is $25 and your average profit per order (before ads) is only $20, you are losing money on every new customer acquisition.
The Full Picture: Real Store Comparison
Here is a real (anonymized) comparison from a home goods store doing $45K/month:
| Line Item | Shopify Shows | Reality (Okiela) |
|---|---|---|
| Revenue | $45,000 | $45,000 |
| COGS | -$18,000 | -$18,000 |
| Gross Profit | $27,000 (60%) | $27,000 (60%) |
| Payment Fees | -- | -$1,605 |
| Shipping Gap | -- | -$2,260 |
| Returns Cost | -- | -$3,800 |
| Ad Spend | -- | -$4,200 |
| Apps & Platform | -- | -$935 |
| True Profit | "$27,000" | $14,200 |
| True Margin | "60%" | 31.5% |
The gap: $12,800/month or $153,600/year in costs the founder was not tracking at the product level.
How to See Your Real Numbers
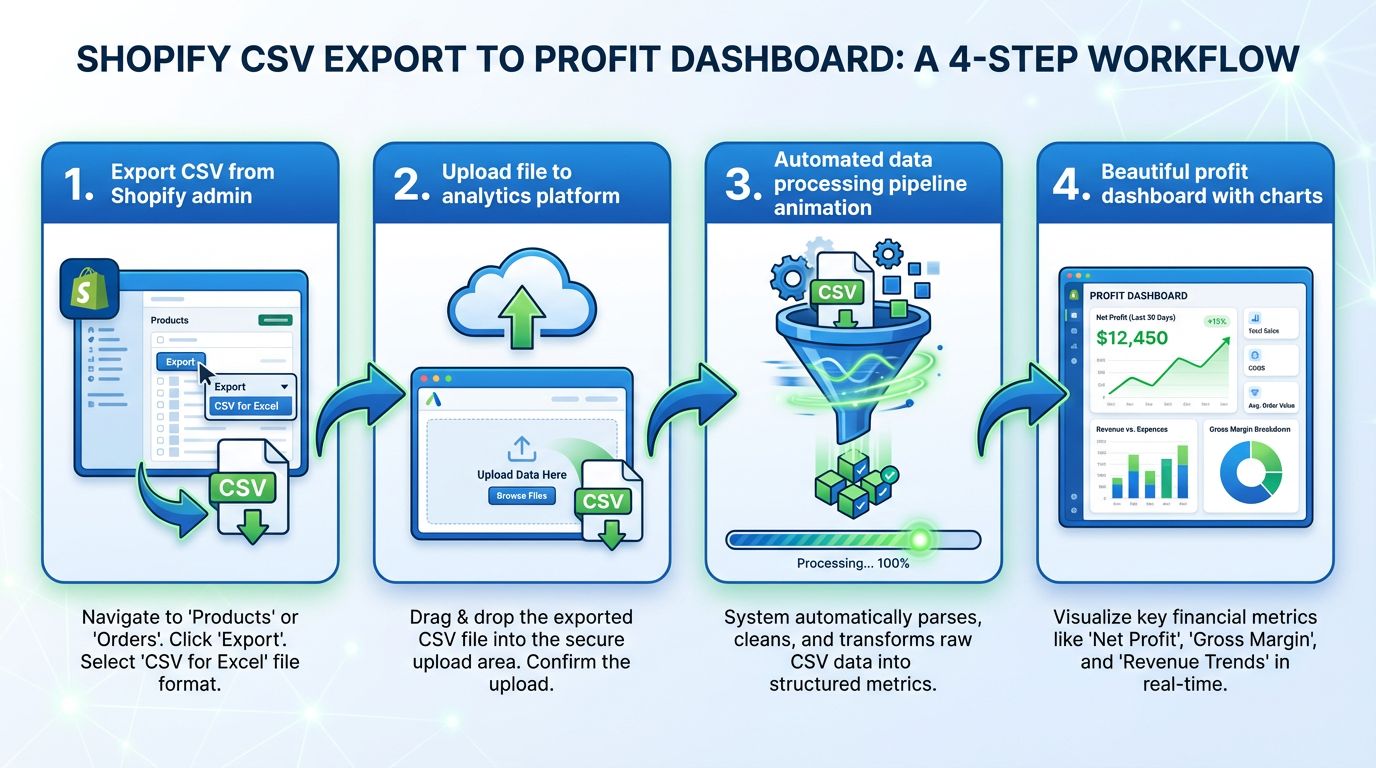
Okiela was built specifically to close these 5 gaps. Upload your Shopify export and see your True Profit in 30 seconds.
Our 5D Pipeline automatically:
- 1Imports your raw sales data
- 2Cleans errors and duplicates
- 3Normalizes across platforms
- 4Enriches with calculated true costs
- 5Analyzes to show real profitability by SKU
The AI then tells you exactly which products are profitable and which ones are losing money -- with specific dollar amounts and recommended actions.
Free plan includes 3 analyses per month. No credit card required.
Find the hidden profit leaks draining your store.
Send one order export. Get your 3 biggest profit leaks back within 48 hours.
Request a free Profit Leakage AuditFree, founder-run, no pitch unless you ask. Every number labeled Verified or Estimated. Remove customer PII before upload.
Enjoyed this article?
Get weekly profit optimization tips and Okiela product news delivered to your inbox.
No spam. Unsubscribe anytime.
Nguyen Tuan Dai
Founder & CEO, Okiela
FP&A analyst with 8+ years in financial modeling. Built Okiela on the side to help e-commerce founders see their real profit numbers.