5 Signs You Are Underpricing Your Products (Data-Backed Guide)
ROAS looks great but profit is flat? Your pricing strategy might be costing you thousands. Here are 5 data-backed warning signs with real benchmarks.
Nguyen Tuan Dai
Founder & CEO, Okiela
Key Takeaways
- 1A 1% pricing improvement drives 8.7% operating profit increase (McKinsey)
- 272% of e-commerce businesses can raise prices 5-15% with minimal volume impact
- 3If your ROAS is high but net margin is below 10%, you are underpricing
- 4Test price increases incrementally: 5-10% for 2 weeks, then measure
- 5Focus repricing on SKUs with strong demand and low margins
Table of Contents (8 sections)
- The Underpricing Trap Explained
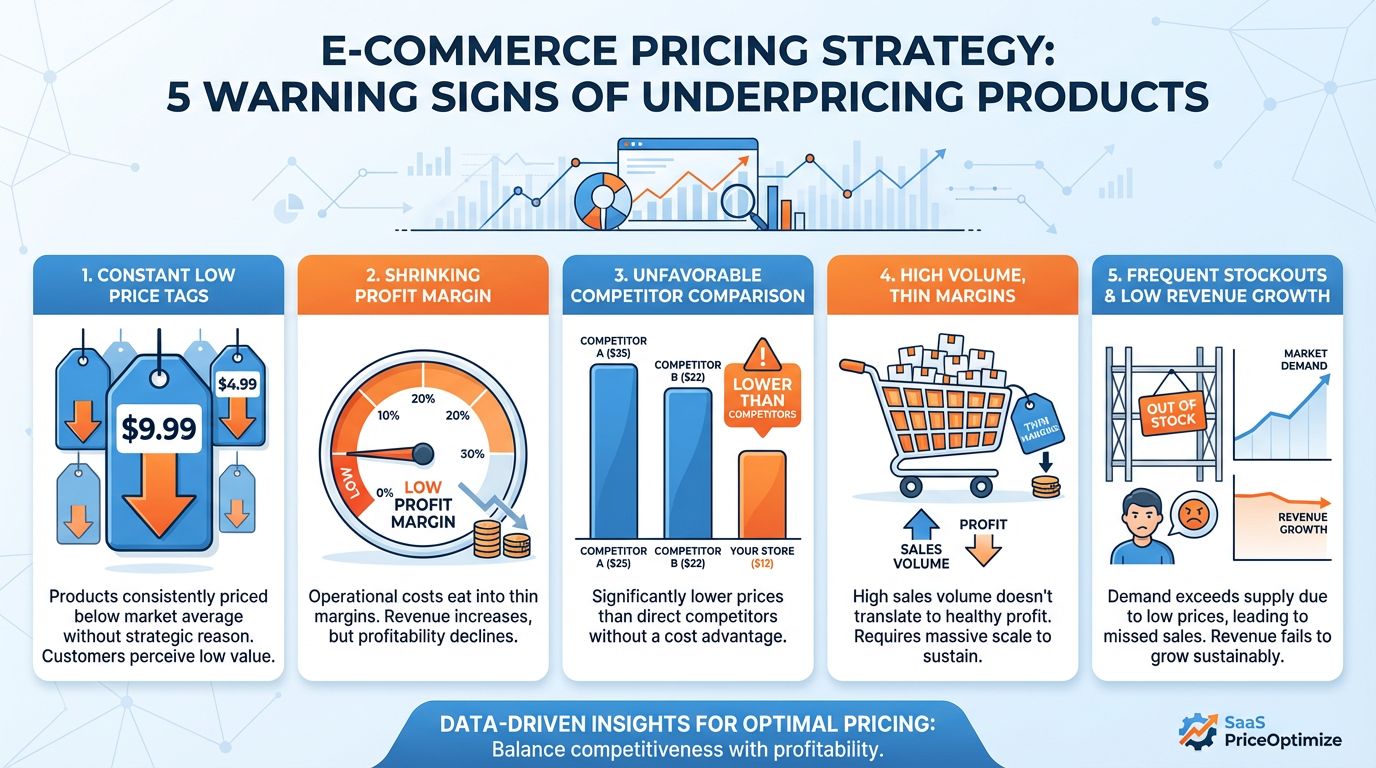
- Sign 1: High ROAS but Low Net Profit Margin
- Sign 2: Competitors Charge 20-40% More for Similar Products
- Sign 3: Your Best-Selling SKU Has the Lowest Margin
- Sign 4: You Cannot Run Ads Profitably
- Sign 5: Return Costs Eliminate Profit on Certain SKUs
- The 4-Step Repricing Strategy
- Real Results from Okiela Users
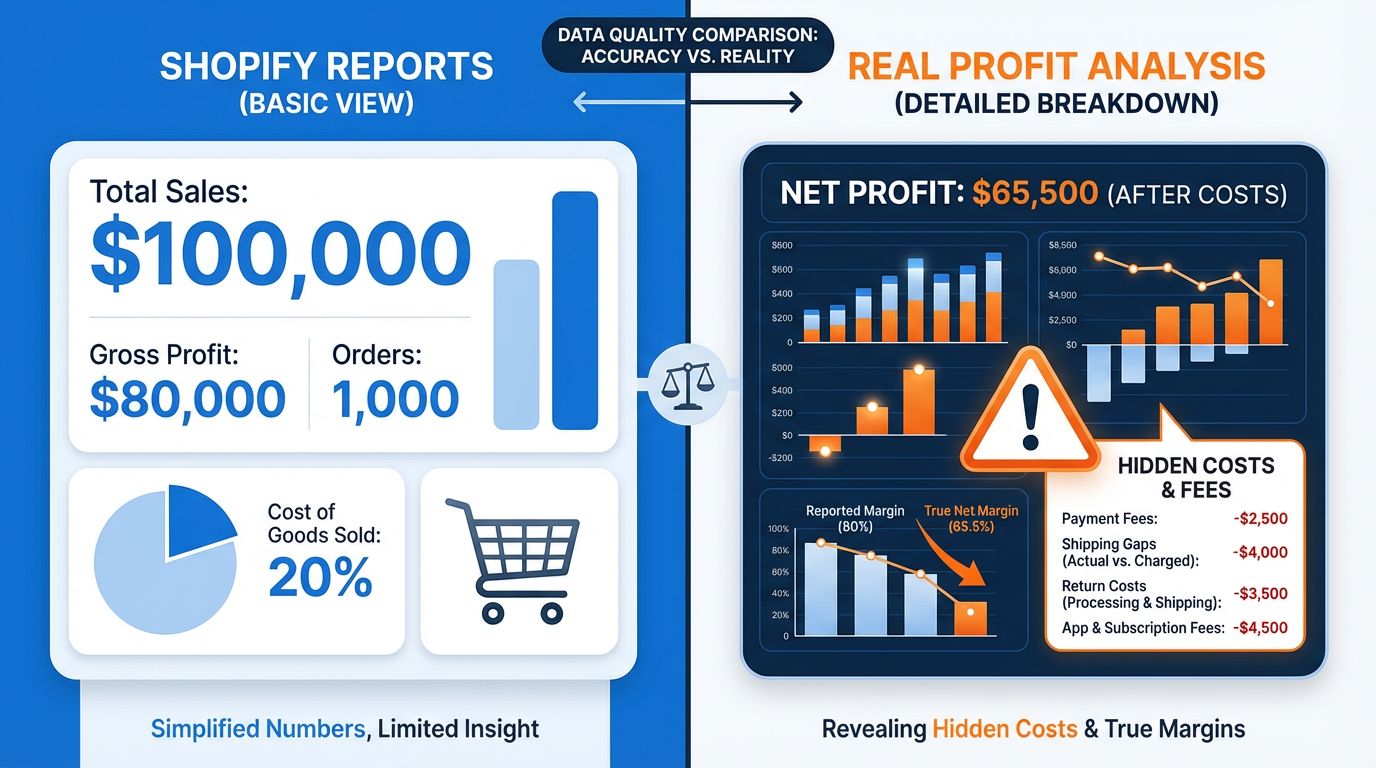
You are running ads, getting sales, and your ROAS looks healthy at 4x or higher. But when you check your bank account at the end of the month, the profit just is not there.
If this sounds familiar, you are likely caught in the underpricing trap -- and you are not alone. According to McKinsey research, a 1% improvement in pricing drives an 8.7% increase in operating profit (more than any other lever including cost-cutting or volume growth).
The Underpricing Trap Explained
Many e-commerce founders focus on revenue growth instead of profit growth. They lower prices to drive volume, assuming more sales will eventually mean more profit. But higher volume with thin margins often means more work for less money.
Here are 5 data-backed warning signs that your products are underpriced:
Sign 1: High ROAS but Low Net Profit Margin
Healthy benchmarks to compare against:
| Metric | Concerning | Healthy | Excellent |
|---|---|---|---|
| ROAS | 2-3x | 4-6x | 7x+ |
| Net Profit Margin | Below 10% | 15-25% | 25%+ |
If your ROAS is above 4x but your net margin is below 10%, something is wrong. High ROAS simply means your ads are efficient relative to revenue -- it says nothing about actual profit.
The fix: Calculate True Profit per SKU (not just ROAS) to find where the margin is leaking.
Sign 2: Competitors Charge 20-40% More for Similar Products
Do a quick competitive analysis across 5-10 competitors:
- 1Search your product category on Amazon, Google Shopping, and competitor sites
- 2Record the price range for similar quality/features
- 3Calculate your position: (Your Price - Lowest Price) / (Highest Price - Lowest Price)
If you consistently land in the bottom 20% of pricing, you have significant room to raise prices without losing meaningful sales volume.
Research from Simon-Kucher & Partners shows that 72% of e-commerce businesses could raise prices by 5-15% with less than 2% volume impact.
Sign 3: Your Best-Selling SKU Has the Lowest Margin
This is the classic volume trap. Your hero product sells the most units but barely breaks even after all costs. Check your top 10 SKUs:
- Calculate True Profit per unit (including shipping, returns, ads)
- Rank by profit margin percentage
- If your #1 seller ranks in the bottom 3 for margin, you are underpricing it
Since this product has proven demand, customers are telling you they value it. You likely have pricing power you are not using.
Sign 4: You Cannot Run Ads Profitably
If your margins are so thin that any meaningful ad spend makes you unprofitable, your pricing model is broken. Here is the math:
- Average CAC (Customer Acquisition Cost): $15-45 for DTC brands
- If your average profit per order (before ads) is less than $20, you cannot sustain paid acquisition
- Without paid acquisition, you are capped on growth
Healthy e-commerce pricing should leave $25-50+ per order for customer acquisition after all other costs.
Sign 5: Return Costs Eliminate Profit on Certain SKUs
Some products have higher return rates. If you have not priced in the full cost of returns, those SKUs are underwater:
- Average return costs: $10-25 per returned item
- A 20% return rate on a $30 product with a $5 margin means you lose money on that SKU
Map your return rate by SKU and calculate the return-adjusted profit. You may find that 15-20% of your catalog is actively losing money.
The 4-Step Repricing Strategy
Here is how to fix underpricing without tanking your sales:
Step 1: Calculate True Profit per SKU
Upload your data to Okiela to see exact profit margins for every product. The AI flags SKUs with margins below your target threshold.
Step 2: Identify Repricing Candidates
Focus on products where:
- Demand is strong (consistent sales volume)
- Competitors charge more for similar items
- Returns are eating margins
Step 3: Test Price Increases Incrementally
Raise prices by 5-10% on selected SKUs. Monitor for 2 weeks:
- Volume drop of less than 5%? The increase is working.
- Volume drop of 5-15%? Margins likely still improved. Calculate net impact.
- Volume drop of 15%+? Roll back and test a smaller increase.
Step 4: Monitor and Iterate
Use Okiela's AI chat to ask: "Which SKUs should I reprice next?" The system continuously analyzes your data to find new optimization opportunities.
Real Results from Okiela Users
Early adopters who identified and fixed underpriced SKUs reported:
- 15-25% improvement in overall profit margins
- $2,000-5,000/month recovered from repriced products
- 30+ minutes/week saved vs. manual spreadsheet analysis
The free plan includes 3 profit analyses per month -- enough to identify your biggest underpricing opportunities.
Find the hidden profit leaks draining your store.
Send one order export. Get your 3 biggest profit leaks back within 48 hours.
Request a free Profit Leakage AuditFree, founder-run, no pitch unless you ask. Every number labeled Verified or Estimated. Remove customer PII before upload.
Enjoyed this article?
Get weekly profit optimization tips and Okiela product news delivered to your inbox.
No spam. Unsubscribe anytime.
Nguyen Tuan Dai
Founder & CEO, Okiela
FP&A analyst with 8+ years in financial modeling. Built Okiela on the side to help e-commerce founders see their real profit numbers.