How AI Finds Hidden Profit Opportunities in Your E-commerce Data
AI is not just for chatbots. See how machine learning identifies pricing opportunities, underperforming SKUs, and profit leaks that humans miss.
Nguyen Tuan Dai
Founder & CEO, Okiela

Key Takeaways
- 1AI-driven pricing yields 2-5% revenue increase and 5-10% margin improvement (McKinsey)
- 2The AI maps every SKU on a profit-volume matrix to identify opportunities
- 3AI-driven pricing can yield 5-10% margin improvement (McKinsey benchmarks)
- 4AI removes emotional bias -- the #1 reason founders underprice products
- 5Get specific recommendations with dollar amounts, not generic advice
Table of Contents (6 sections)
AI is not just for writing blog posts and generating images. In e-commerce, AI can find profit opportunities that even experienced analysts miss -- specifically in pricing optimization and SKU performance analysis.
The reason is simple: humans are great at pattern recognition on small datasets, but e-commerce data involves thousands of SKUs, seasonal patterns, cross-channel dynamics, and customer behavior signals. AI processes all of this simultaneously.
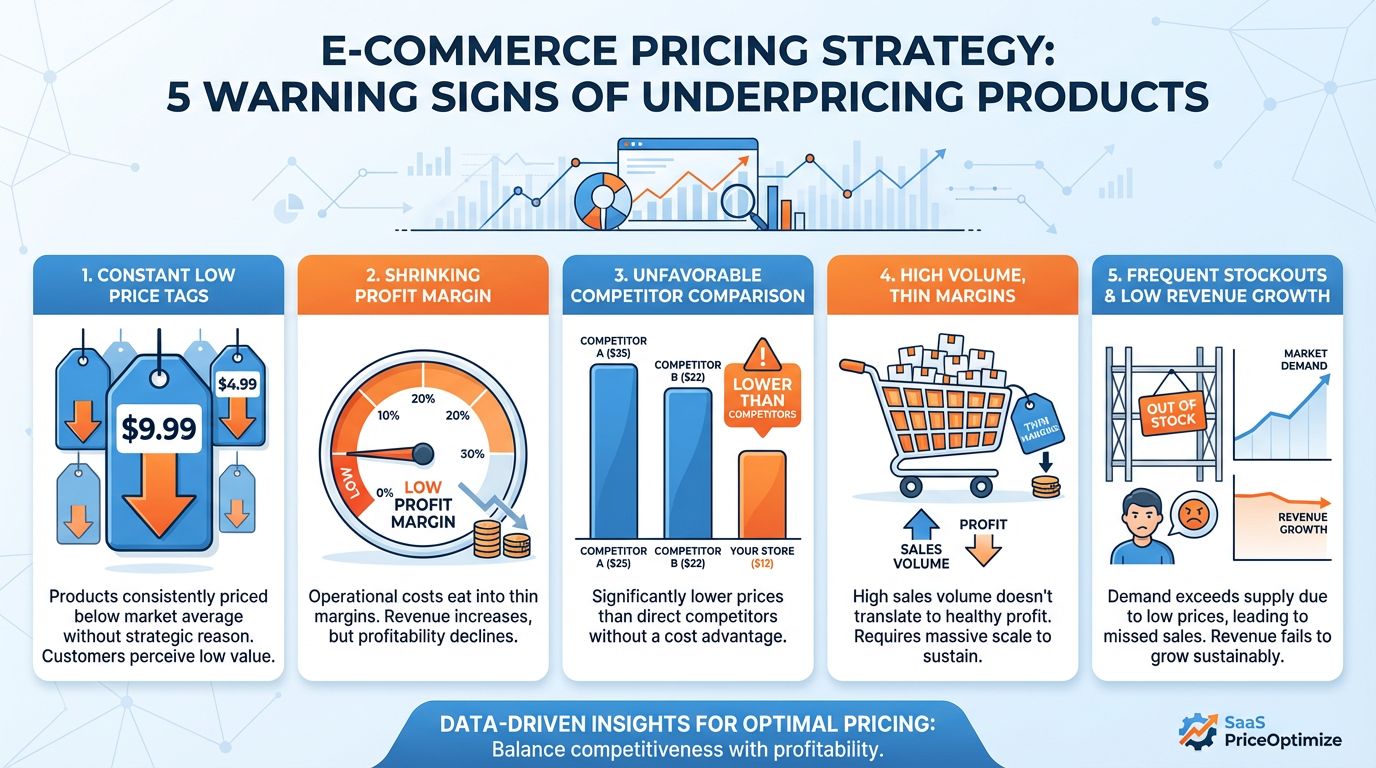
The Problem with Manual Pricing
Most store owners set prices based on one of three methods:
- 1Competitor pricing (race to the bottom -- everyone loses margin)
- 2Cost-plus markup (ignores demand elasticity and willingness to pay)
- 3Gut feeling (inconsistent and prone to emotional bias)
None of these methods account for the complex relationships between price, volume, margin, customer segments, and seasonal demand.
McKinsey research shows that companies using AI-driven pricing see 2-5% revenue increases and 5-10% margin improvements within the first 6 months.
How AI Pricing Analysis Works (In Plain English)
Here is what happens when you upload your data to Okiela:
Phase 1: Pattern Discovery
The AI analyzes your historical data to find patterns humans would miss:
- Price-insensitive products: Items where a 10% price increase only reduces volume by 1-2% (these are goldmines for repricing)
- Loss leaders: Products driving traffic but losing money per unit
- Seasonal demand curves: Products that could be priced higher in peak months
- Bundle candidates: Products frequently purchased together that could be bundled for higher AOV
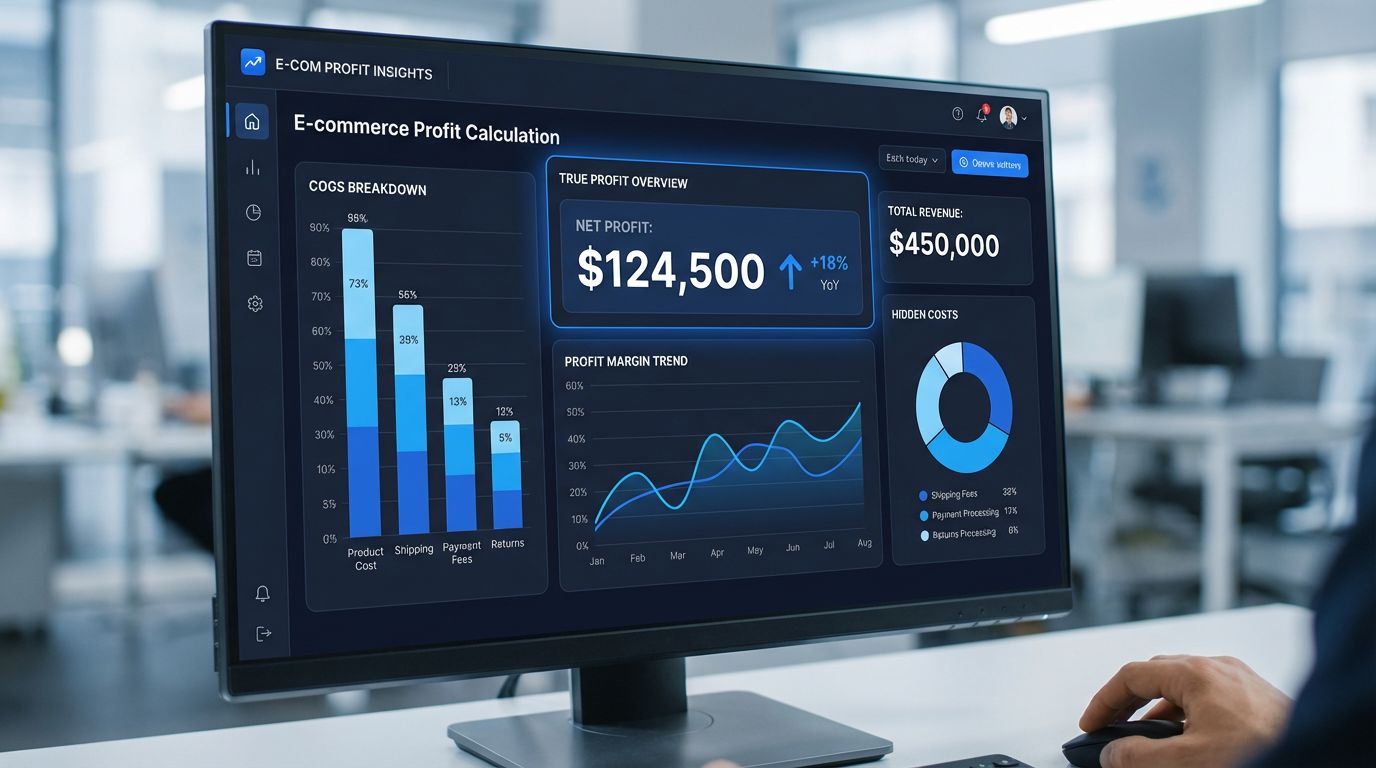
Phase 2: Profitability Mapping
Every SKU gets mapped on two dimensions:
| Low Volume | High Volume | |
|---|---|---|
| High Margin | Niche Winners (promote more) | Hero SKUs (protect pricing) |
| Low Margin | Consider discontinuing | Underpriced (reprice up) |
The "High Volume + Low Margin" quadrant is where most hidden profit lives. These products have proven demand but thin margins -- exactly the candidates for strategic price increases.
Phase 3: Specific Recommendations
Instead of vague advice, Okiela's AI generates specific, actionable recommendations:
Examples from real user sessions:
- "Raise Jump Rope Speed from $24.99 to $29.74 to achieve 30% margin. Expected volume impact: -3% (within acceptable range)"
- "Bundle Yoga Mat + Resistance Band at $54.99 (vs. $59.98 separately). Projected uplift: +$15 profit per bundle, +22% bundle adoption rate"
- "Discontinue Travel Kit SKU-4420. Losing $3.20 per unit after returns (32% return rate). Reallocate ad spend to Hero SKUs"
- "Increase prices on Winter Collection by 8% in November-January. Historical data shows price sensitivity drops 40% during holiday season"
What AI Profit Analysis Can Achieve
Based on industry benchmarks for AI-driven pricing optimization (McKinsey, Simon-Kucher):
| Metric | Manual Analysis | With AI Pricing | Potential Gain |
|---|---|---|---|
| Profit Margin | 20-25% avg | 27-32% avg | +5-10% points |
| Time on Analysis | 4+ hours/week | 30 min/week | -87% |
| Underpriced SKUs Identified | Few | Most | Comprehensive |
| Price Testing Cycles | Monthly | Weekly | 4x faster |
The Human + AI Advantage
AI does not replace your business judgment. It augments it by:
- 1Processing thousands of data points simultaneously that would take humans weeks
- 2Identifying non-obvious correlations (e.g., certain products sell better on weekdays vs. weekends)
- 3Removing emotional bias from pricing decisions (the #1 reason founders underprice)
- 4Providing data-backed confidence for price changes (show your team the numbers, not just intuition)
- 5Continuously learning from new data (recommendations improve as you upload more data)
Getting Started with AI Profit Analysis
The fastest way to try this:
- 1Upload your Shopify export to Okiela (takes 10 seconds)
- 2Wait 30 seconds for the 5D Pipeline to process
- 3Open the AI Chat and ask: "Which SKU should I reprice?"
- 4Get specific recommendations with dollar amounts
- 5Implement the top recommendation and measure results after 2 weeks
The free plan includes 3 analyses per month and full AI chat access. Most users find their first repricing opportunity within 5 minutes.
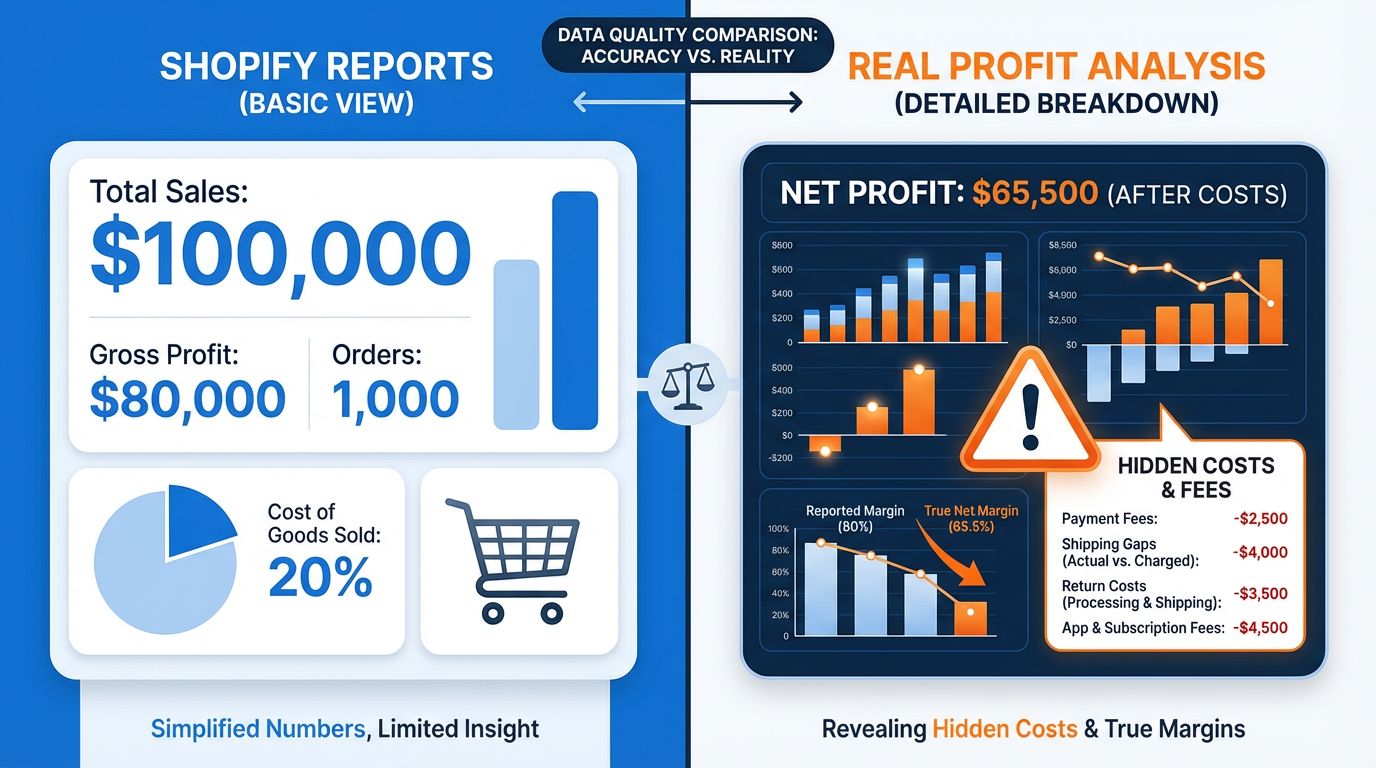
The Bottom Line
E-commerce is a game of margins. The founders who use data and AI to optimize pricing will outperform those who rely on gut feeling -- not because they work harder, but because they have better information.
Okiela was built to give every online seller the same analytical power that used to require a full-time data analyst. Try it free and see what hidden profit is waiting in your data.
Find the hidden profit leaks draining your store.
Send one order export. Get your 3 biggest profit leaks back within 48 hours.
Request a free Profit Leakage AuditFree, founder-run, no pitch unless you ask. Every number labeled Verified or Estimated. Remove customer PII before upload.
Enjoyed this article?
Get weekly profit optimization tips and Okiela product news delivered to your inbox.
No spam. Unsubscribe anytime.
Nguyen Tuan Dai
Founder & CEO, Okiela
FP&A analyst with 8+ years in financial modeling. Built Okiela on the side to help e-commerce founders see their real profit numbers.