Your Best-Selling Product Might Be Your Biggest Profit Killer (How to Check)
The product you sell the most could be the one losing you the most money. Here is how to check in 5 minutes -- with real store examples.
Nguyen Tuan Dai
Founder & CEO, Okiela
Key Takeaways
- 1About 1 in 3 stores has a best-selling product that actually loses money per unit
- 24 warning signs: never raised price, heavy discounting, high return rate, scaling ads on low margins
- 3The full profitability check requires 5 numbers: price, COGS, shipping, processing, and ad spend
- 4Discount codes can flip a barely-profitable product into a loss-maker
- 5Fixing just the bottom 20% of your catalog can improve overall margin by 4-8 points
Table of Contents (6 sections)
Let me tell you about a product called the "Travel Kit."
It was the #1 seller for a Shopify store doing $80K/month. 400 units sold every month. 5-star reviews. Customers loved it. The founder called it "our hero product."
Then we ran the numbers through a proper profit analysis.
The Travel Kit was losing $3.20 on every single unit sold. Not making $3.20. LOSING $3.20. Every month, 400 units x $3.20 = $1,280 in losses. Their "hero product" was draining $15,360 per year from the business.
The founder had no idea. And he is not alone. I see this pattern in roughly 1 out of 3 stores I analyze.
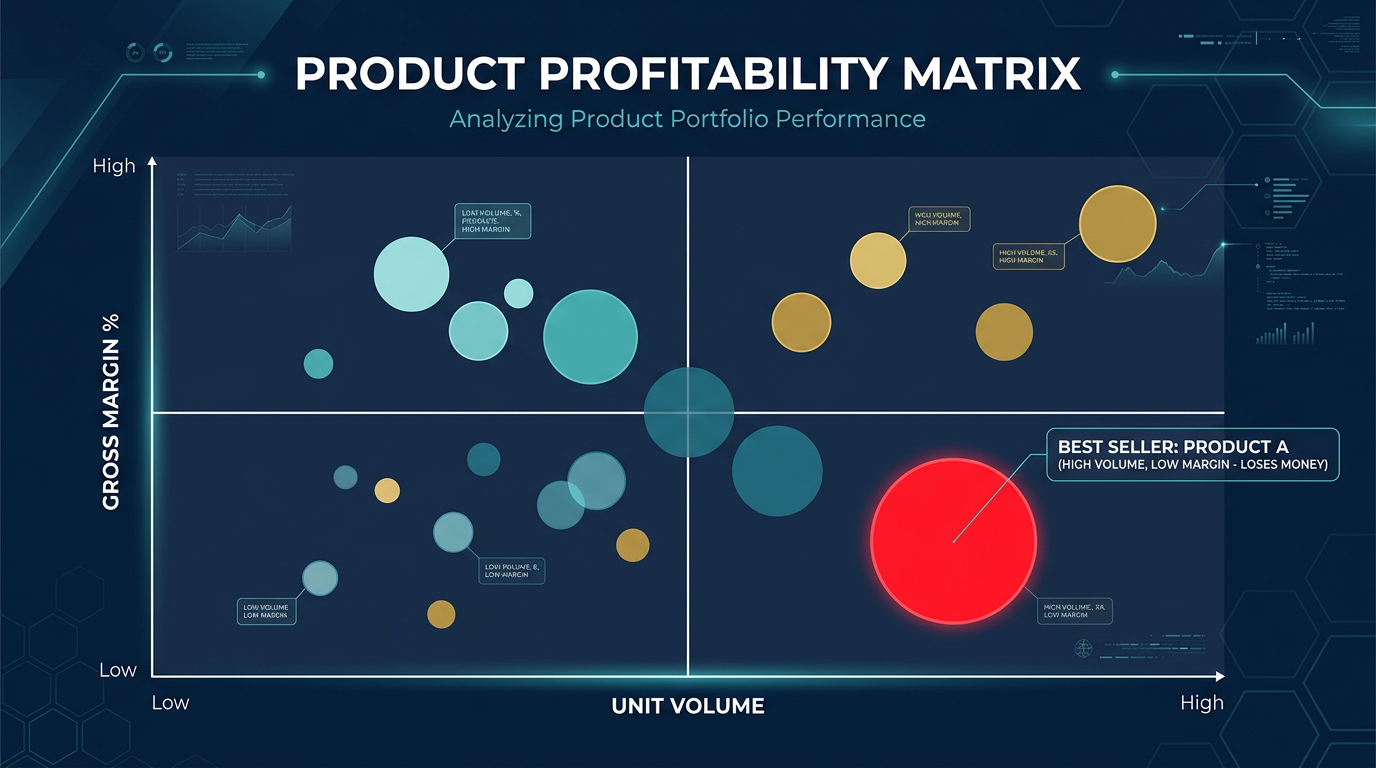
Why Best Sellers Often Have the Worst Margins
It sounds counterintuitive. Your best seller has the most demand, the most reviews, the most ad spend behind it. How can it be unprofitable?
Three reasons:
Reason 1: You priced it to sell, not to profit. When you launched this product, you probably priced it competitively to gain traction. Sales took off. Reviews came in. You never raised the price because "it is working." But "working" in terms of sales volume is different from "working" in terms of putting money in your bank account.
Reason 2: It gets the most ad spend. Your best seller gets the lion's share of your advertising budget because it converts well. But have you calculated the ACTUAL customer acquisition cost for that specific product? A product with a $8 margin that needs $15 in ad spend per sale is losing $7 per order.
Reason 3: It has the highest return rate. Popular products get returned more -- by pure volume, if nothing else. That Travel Kit? 32% return rate. Each return cost the business $12 in processing costs. On 400 monthly sales, 128 were returned, costing $1,536/month in return processing alone.
The SKU Profitability Check (5 Minutes)
Here is how to check if your best seller is actually making money. You need 5 numbers:
Number 1: Selling Price
What the customer actually pays after discounts. Not your list price -- the price they paid.
Example: Travel Kit sells for $34.99, but average actual price paid (after discount codes) is $29.99.
Number 2: True Landed Cost (COGS)
Not just the product cost. Include:
- Product purchase price: $11.00
- Inbound freight per unit: $1.20
- Duties/tariffs per unit: $0.80
- Packaging: $0.60
- Total landed: $13.60
Number 3: Shipping Cost Per Unit
What you actually pay the carrier, minus what the customer pays for shipping.
- Carrier cost: $8.50
- Customer paid: $5.99
- Gap: -$2.51
Number 4: Payment Processing Fee
2.9% + $0.30 of the selling price.
$29.99 x 2.9% + $0.30 = $1.17
Number 5: Allocated Ad Spend
Total ad spend on this product divided by units sold.
$2,400/month in ads for this product / 400 units = $6.00 per unit.
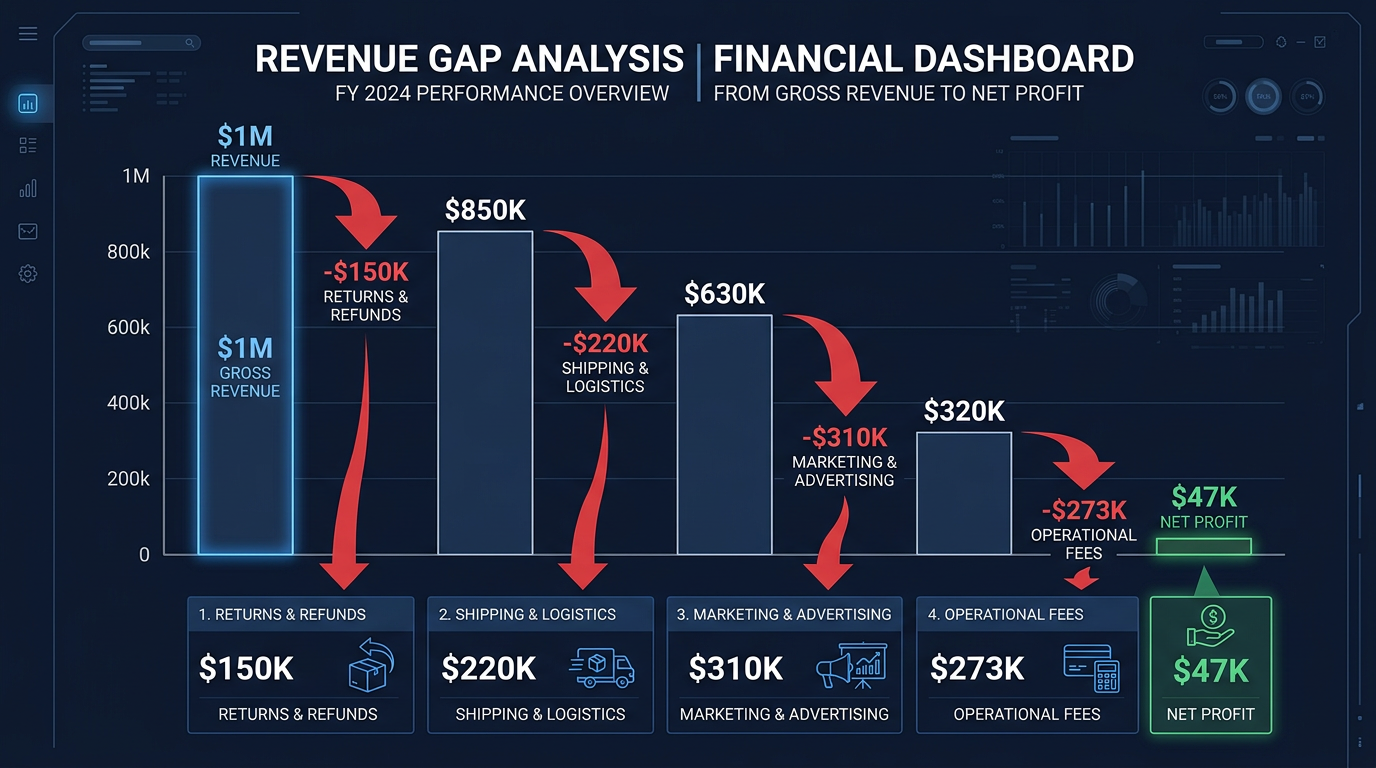
The Math
| Line | Amount |
|---|---|
| Selling price | $29.99 |
| - True COGS | -$13.60 |
| - Shipping gap | -$2.51 |
| - Payment processing | -$1.17 |
| - Allocated ad spend | -$6.00 |
| Profit before returns | $6.71 |
| - Return cost (32% rate x $12/return) | -$3.84 per unit avg |
| True profit per unit | $2.87 |
Wait -- $2.87? That does not look terrible. But I said it was losing $3.20. What gives?
The Missing Piece: Discount Codes
The $29.99 average selling price already factors in discount usage. But the founder was running a separate 15% discount promotion on this product, bringing SOME orders down to $25.49. When you weighted the actual transaction prices instead of using the average:
- 60% of orders at $29.99
- 40% of orders at $25.49 (15% discount applied)
- Weighted average revenue: $28.19
- Profit drops to: $1.07/unit... before the 32% return rate
- After returns: -$3.20 per unit
The discount was the tipping point. Without it, the product barely broke even. With the discount, it actively lost money.
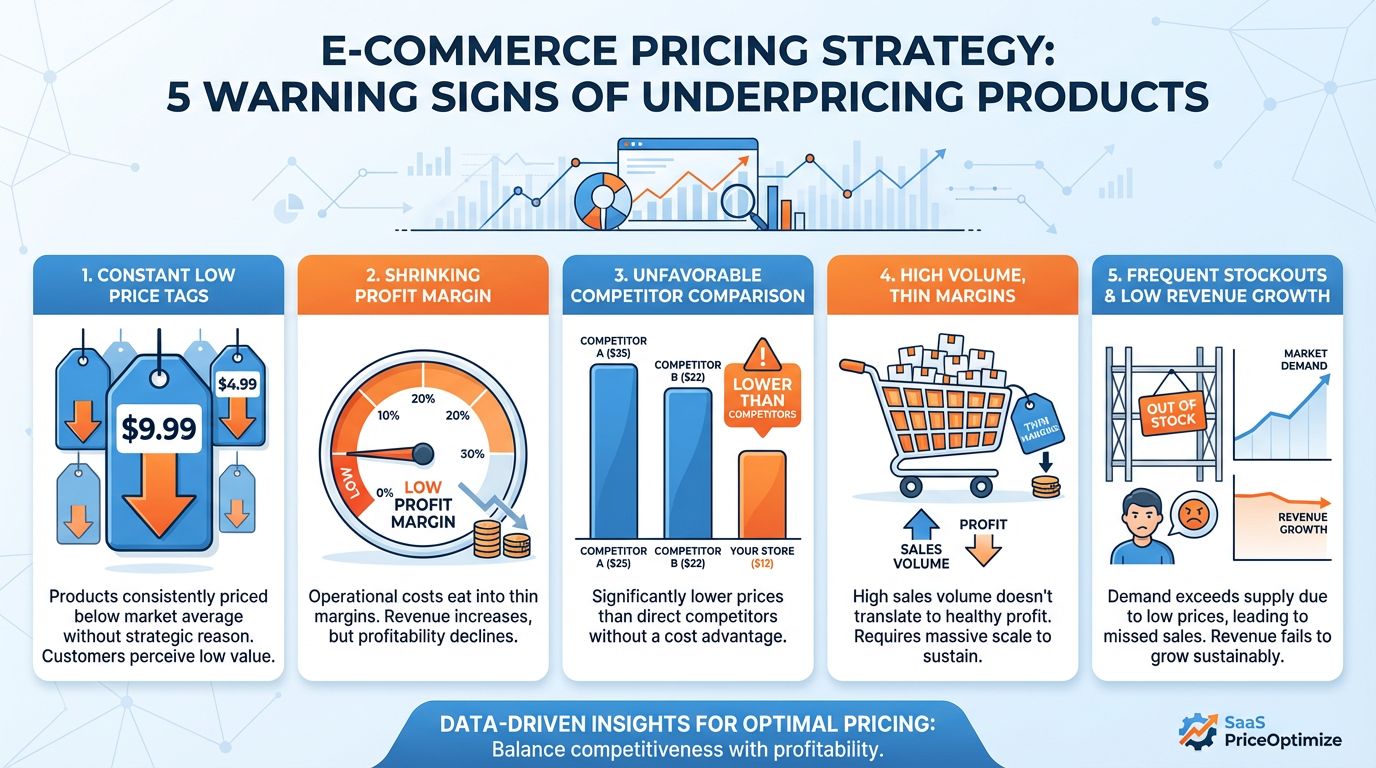
The 4 Warning Signs Your Best Seller Is a Profit Killer
Sign 1: You Have Never Raised the Price
If your best seller has been the same price since launch, and your costs have gone up (they always do), your margin has been silently eroding.
Sign 2: It Gets the Most Discount Codes Used
Best sellers often get promotional discounts because "it will sell more." But each discount directly cuts margin. A 15% discount on a product with 20% margin leaves you with 5% -- before ad spend.
Sign 3: The Return Rate Is Above 15%
Products with high return rates are not just losing the returned revenue. Each return costs $8-25 to process. A product with a 25% return rate is essentially paying $2-6 per unit sold in return processing costs.
Sign 4: You Are Spending More on Ads to "Scale" It
Scaling ad spend on a low-margin product just scales the losses. If your contribution margin per unit is below $5, doubling ad spend will not make it profitable. It will make the losses twice as big.
What the Travel Kit Founder Did
He had three options:
Option A: Raise the price. He increased the Travel Kit from $34.99 to $39.99 (14% increase). Volume dropped 12%, but profit per unit went from -$3.20 to +$4.80. Net result: more money in the bank with fewer orders.
Option B: Kill the discount. He stopped running 15% discount codes on the Travel Kit specifically. Volume dropped 8%, but average selling price went back to $34.99.
Option C: Reduce COGS. He negotiated with his supplier for a 10% cost reduction on orders above 1,000 units. Landed cost dropped from $13.60 to $12.24.
He did all three. The Travel Kit went from losing $15,360/year to generating $23,000/year in profit. Same product, same customers, same store. Just better math.
How to Check Your Entire Catalog
You do not have to do this math for every SKU by hand. Here is the fast way:
- 1Export your Shopify orders data (last 3 months)
- 2Upload to Okiela (free, takes 30 seconds)
- 3The profit engine calculates true profit per SKU after ALL costs
- 4Sort by profit margin -- lowest to highest
- 5The bottom 20% is your hit list
The AI will even tell you which specific SKUs to reprice and by how much.
Most founders who do this for the first time discover 3-5 products that are actively losing money. Fixing just those products typically improves overall store margin by 4-8 percentage points.
The Bottom Line
Sales volume is not success. Revenue is not profit. And your best seller is not necessarily your best product.
The only way to know is to run the numbers -- all of them. Not just COGS. Not just revenue. The complete picture: landed cost, shipping, returns, processing fees, ad spend, and discounts.
Do it once. Be honest with what you find. Then fix what is broken.
Your store might be one pricing adjustment away from being significantly more profitable. You just cannot see it until you look at the right numbers.
Find the hidden profit leaks draining your store.
Send one order export. Get your 3 biggest profit leaks back within 48 hours.
Request a free Profit Leakage AuditFree, founder-run, no pitch unless you ask. Every number labeled Verified or Estimated. Remove customer PII before upload.
Enjoyed this article?
Get weekly profit optimization tips and Okiela product news delivered to your inbox.
No spam. Unsubscribe anytime.
Nguyen Tuan Dai
Founder & CEO, Okiela
FP&A analyst building ecommerce tools on the side. Helping founders see their real numbers since 2025.