Ecommerce Profit Benchmarks 2026: What Good Margin Means After Real Costs
Is 12% net margin good or terrible? It depends on your category, size, and channel mix. Here are the real benchmarks.
Nguyen Tuan Dai
Founder & CEO, Okiela
Quick answer
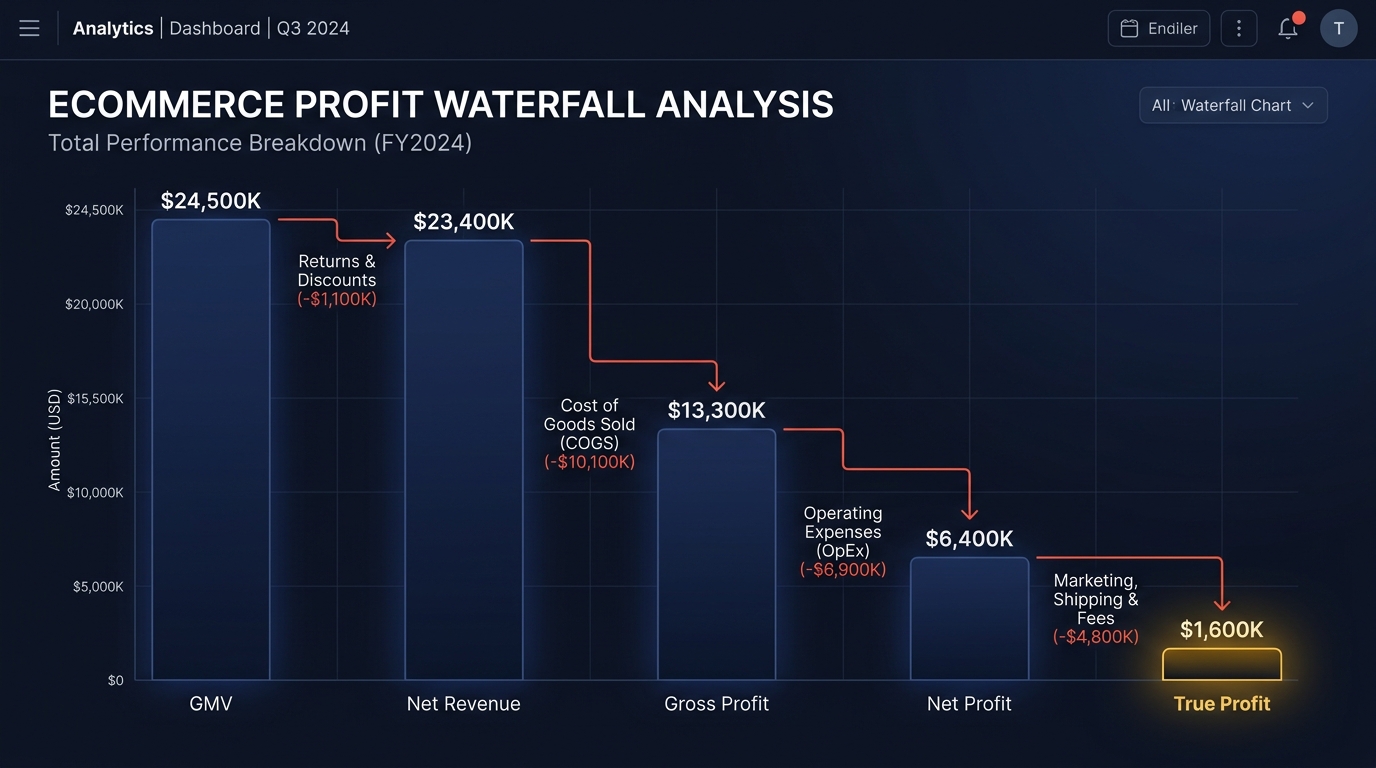
A healthy ecommerce net profit margin in 2026 is roughly 10-20% — but only after COGS, fees, shipping, discounts, refunds and ads. Benchmarks vary by category and size, and they are only useful once your numbers are calculated on the same true-profit basis. Here are the 2026 ranges and how to check yours.
Key Takeaways
- 1Median DTC net margin is 10% but top 25% hit 18% -- moving from median to top quartile is an 80% profit improvement
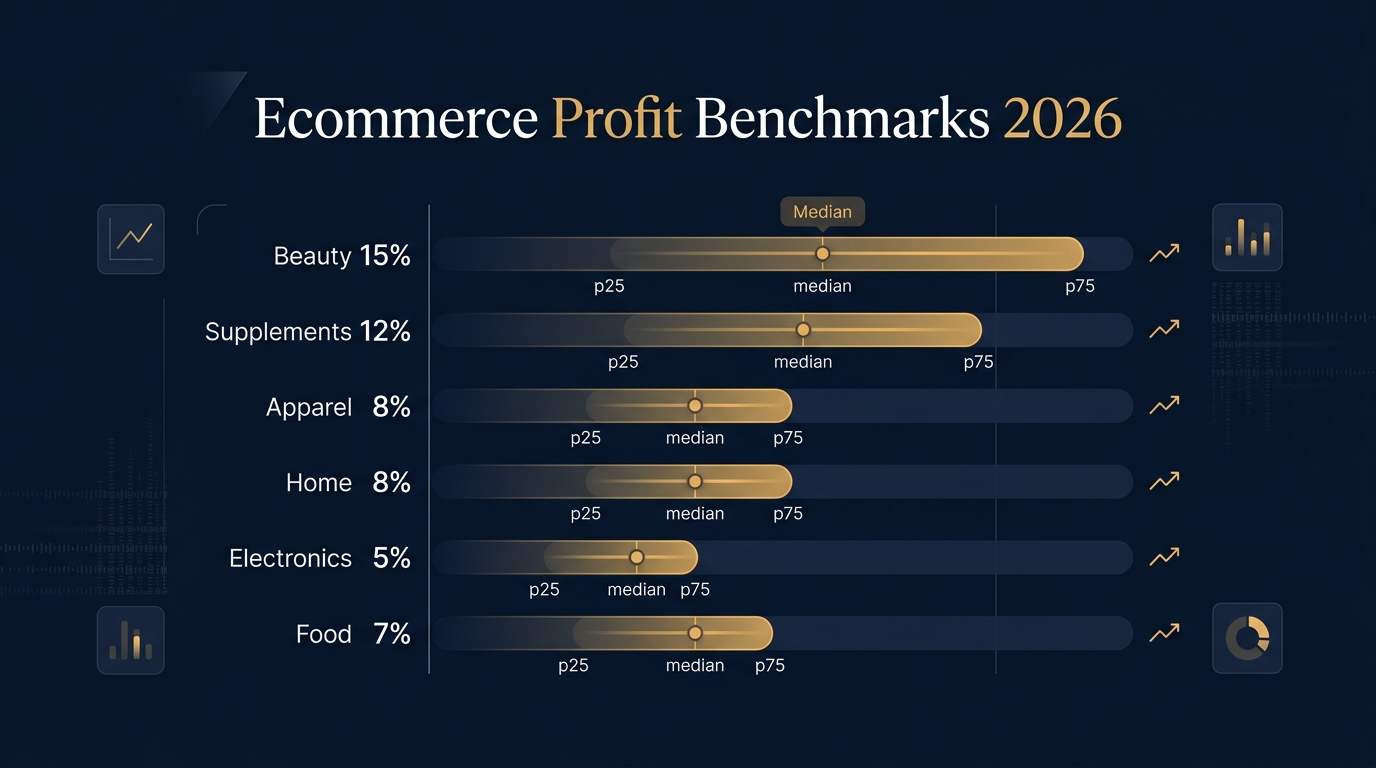
- 2Benchmarks vary dramatically by category: beauty (15% median margin) vs electronics (5%) -- compare against YOUR vertical, not overall averages
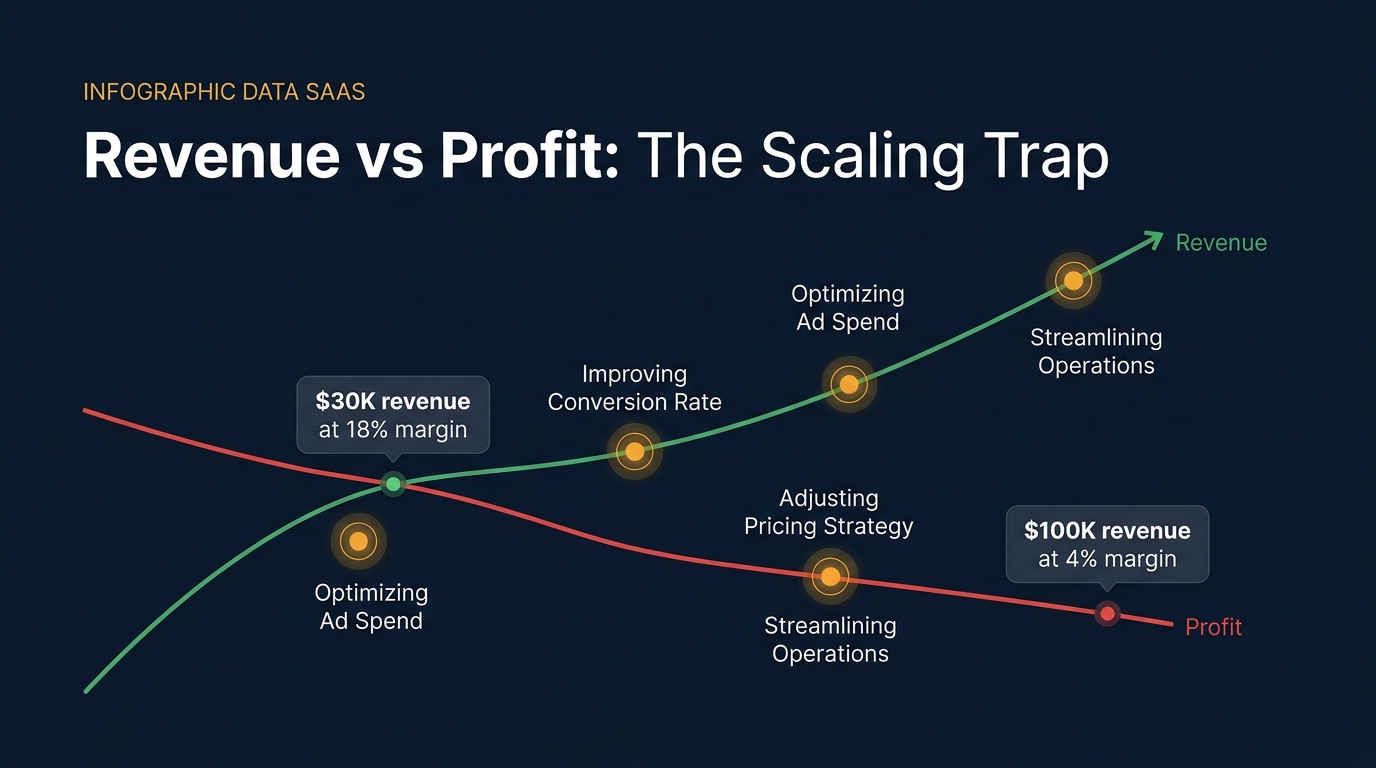
- 3Store size matters: $30K-$100K is the danger zone where most margin destruction happens during scaling
- 4Three levers to move from median to top 25%: reduce COGS 10% (+3-5pp), cut returns 30% (+2-4pp), increase AOV 20% (+1-3pp) = +6-12 points total
- 510 monthly KPIs every store should track: gross margin, net margin, CAC, LTV:CAC, AOV, return rate, COGS %, shipping %, ad spend %, CCC
Table of Contents (7 sections)
"Is my profit margin good?"
This is the most common question founders ask me. And the honest answer is: it depends.
A 12% net margin is excellent for a supplements brand, average for an apparel brand, and concerning for a digital products business. Context matters enormously.
Here are the real benchmarks for 2026, broken down by category, store size, and channel.
Overall Ecommerce Profit Benchmarks (2026)
Let us start with the big picture. These are median values across thousands of DTC Shopify stores:
| Metric | Bottom 25% | Median | Top 25% | Top 10% |
|---|---|---|---|---|
| Gross Margin | 38% | 55% | 68% | 75% |
| Net Margin | 2% | 10% | 18% | 25% |
| AOV | $35 | $65 | $110 | $180 |
| Return Rate | 18% | 12% | 7% | 3% |
| COGS % of Revenue | 55% | 40% | 30% | 22% |
| Shipping % of Revenue | 15% | 10% | 7% | 5% |
| Ad Spend % of Revenue | 25% | 15% | 10% | 6% |
| Customer Acquisition Cost | $65 | $42 | $25 | $15 |
Key insight: The gap between median and top 25% is massive. If you are at median and move to top 25%, your net margin goes from 10% to 18% — an 80% improvement.
Benchmarks by Category
Apparel & Fashion
| Metric | Low | Median | High |
|---|---|---|---|
| Gross Margin | 45% | 60% | 72% |
| Net Margin | -2% | 8% | 18% |
| Return Rate | 20% | 30% | 40% |
| COGS % | 28% | 40% | 55% |
| AOV | $45 | $75 | $120 |
What makes or breaks fashion: Return rate. The gap between a 20% and 40% return rate on $100K revenue is $20K in return processing costs. Size guides and fit tools are not optional — they are profit tools.
Beauty & Personal Care
| Metric | Low | Median | High |
|---|---|---|---|
| Gross Margin | 60% | 72% | 82% |
| Net Margin | 5% | 15% | 28% |
| Return Rate | 3% | 8% | 12% |
| COGS % | 18% | 28% | 40% |
| AOV | $35 | $55 | $85 |
What makes or breaks beauty: Subscription/replenishment rate. Beauty brands with 30%+ subscription revenue have 2-3x higher net margin than one-time-purchase brands because CAC is amortized.
Supplements & Health
| Metric | Low | Median | High |
|---|---|---|---|
| Gross Margin | 55% | 68% | 80% |
| Net Margin | 3% | 12% | 22% |
| Return Rate | 2% | 5% | 10% |
| COGS % | 20% | 32% | 45% |
| AOV | $40 | $60 | $95 |
What makes or breaks supplements: Repeat purchase rate. Supplements are consumables — if customers reorder without ads, your effective CAC drops dramatically.
Home & Kitchen
| Metric | Low | Median | High |
|---|---|---|---|
| Gross Margin | 40% | 52% | 65% |
| Net Margin | 0% | 8% | 16% |
| Return Rate | 5% | 10% | 18% |
| COGS % | 35% | 48% | 60% |
| AOV | $55 | $95 | $180 |
What makes or breaks home goods: Shipping costs. Large, heavy items have disproportionate shipping costs. Stores that optimize packaging and carrier mix save 3-5% of revenue.
Electronics & Gadgets
| Metric | Low | Median | High |
|---|---|---|---|
| Gross Margin | 25% | 38% | 52% |
| Net Margin | -5% | 5% | 14% |
| Return Rate | 8% | 15% | 25% |
| COGS % | 48% | 62% | 75% |
| AOV | $65 | $120 | $250 |
What makes or breaks electronics: COGS and warranty costs. Electronics have the lowest gross margins of any ecommerce category. Success requires either premium pricing (Apple model) or extreme operational efficiency.
Food & Beverage
| Metric | Low | Median | High |
|---|---|---|---|
| Gross Margin | 35% | 50% | 65% |
| Net Margin | -3% | 7% | 18% |
| Return Rate | 1% | 3% | 5% |
| COGS % | 35% | 50% | 65% |
| AOV | $30 | $50 | $80 |
What makes or breaks food/bev: Shipping costs and spoilage. Temperature-controlled shipping can cost 3-5x standard. Stores that can ship shelf-stable products have a massive margin advantage.
Benchmarks by Store Size
Store size changes the benchmarks significantly:
| Revenue/Month | Median Net Margin | Why |
|---|---|---|
| Under $10K | -5% to 5% | Still finding product-market fit; high CAC relative to revenue |
| $10K-$30K | 5% to 12% | Unit economics stabilizing; still heavy on founder time |
| $30K-$100K | 8% to 18% | Scaling phase; margins depend on how well costs are managed |
| $100K-$500K | 12% to 22% | Operational leverage kicks in; team costs are the key variable |
| Above $500K | 15% to 28% | Supplier leverage, brand equity, and repeat customers drive margin |
Key insight: The jump from $30K to $100K is where most margin destruction happens (see our scaling article). Founders who maintain margins through this phase typically have 3-5x higher total profit at $100K than those who sacrifice margin for growth.
The 10 KPIs to Track Monthly
| # | KPI | How to Calculate | Your Target |
|---|---|---|---|
| 1 | Gross Margin | (Revenue - COGS) / Revenue | Above category median |
| 2 | Net Margin | Net Profit / Revenue | Above category median |
| 3 | CAC | Total Marketing Spend / New Customers | Below $50 (DTC average) |
| 4 | LTV:CAC Ratio | Customer Lifetime Value / CAC | Above 3:1 |
| 5 | AOV | Total Revenue / Total Orders | Above category median |
| 6 | Return Rate | Returns / Total Orders | Below category median |
| 7 | COGS % | COGS / Revenue | Below category median |
| 8 | Shipping % | Total Shipping / Revenue | Below 10% |
| 9 | Ad Spend % | Total Ad Spend / Revenue | Below 15% |
| 10 | Cash Conversion Cycle | DIO + DSO - DPO | Below 45 days |
Where to Find Your Numbers
The challenge is that most Shopify stores do not have easy access to these metrics. Shopify Analytics shows revenue and orders but not:
- True COGS per product
- Real profit margin
- Accurate shipping cost per order
- Contribution margin per SKU
This is exactly what Okiela solves. Upload your Shopify CSV export (free, 3 analyses/month), and the dashboard shows you every metric in this article — with your real data, not estimates.
How to Move From Median to Top 25%
If you are at median in your category and want to move to top 25%, focus on these three levers:
Lever 1: Reduce COGS by 10% (see our COGS negotiation guide)
- Impact: +3-5 percentage points margin
Lever 2: Reduce return rate by 30% (better product pages, size guides, quality)
- Impact: +2-4 percentage points margin
Lever 3: Increase AOV by 20% (bundles, upsells, free shipping threshold)
- Impact: +1-3 percentage points margin (from better fixed-cost absorption)
Combined impact: +6-12 percentage points. That moves a median 10% net margin store to 16-22% — solidly in the top 25%.
The Bottom Line
Benchmarks are not scorecards. They are roadmaps. Knowing where you stand relative to your category tells you exactly where to focus your effort.
Upload your Shopify data to Okiela (free, 3 analyses/month) and compare your numbers to these benchmarks. The dashboard shows your percentile ranking for key metrics and flags where you have the biggest improvement opportunity.
Find the hidden profit leaks draining your store.
Send one order export. Get your 3 biggest profit leaks back within 48 hours.
Request a free Profit Leakage AuditFree, founder-run, no pitch unless you ask. Every number labeled Verified or Estimated. Remove customer PII before upload.
Frequently asked questions
What is a good net profit margin for an ecommerce store in 2026?
For most DTC/Shopify stores, a healthy net margin is roughly 10-20% after all costs (COGS, fees, shipping, discounts, refunds, ads). Below ~5% net is fragile; above ~20% is strong. Ranges differ by category — apparel and high-COGS niches sit lower.
Why do benchmarks mislead ecommerce founders?
Most founders compare a gross or pre-ad margin against a true net benchmark — apples to oranges. A benchmark is only useful once your own number is calculated after every cost layer on the same basis.
How do I calculate my true profit margin to compare?
Take net revenue, subtract COGS, fees, shipping, refunds and ad spend, then divide by net revenue. Or upload one order export to Okiela and get your true margin (labeled Verified/Estimated) in under a minute.
Enjoyed this article?
Get weekly profit optimization tips and Okiela product news delivered to your inbox.
No spam. Unsubscribe anytime.
Nguyen Tuan Dai
Founder & CEO, Okiela
FP&A analyst building ecommerce tools on the side. Helping founders see their real numbers since 2025.