How to Scale Your Ecommerce Store Without Killing Your Profit Margin
Most stores that double revenue see profit margin drop by 30-50%. Here is the scaling playbook that keeps margins intact.
Nguyen Tuan Dai
Founder & CEO, Okiela
Key Takeaways
- 1Most stores that double revenue see profit margin drop 30-50% -- some end up making less total profit despite higher revenue
- 25 margin killers of scaling: ad efficiency drops, shipping costs rise, return rates climb, team costs jump in steps, COGS per unit increases
- 3Floor margin formula: Fixed Costs / Revenue + Minimum Acceptable Profit % -- scale only when variable margin stays above this
- 4Scale ad spend in 20-30% weekly increments and pause at any ROAS below your floor; do not jump from $2K to $15K overnight
- 5A skincare brand scaled $30K to $100K in 8 months with only 3-point margin drop (22% to 19%) by locking supplier terms and automating before hiring
Table of Contents (4 sections)
Here is the dirty secret of ecommerce scaling: most stores that double their revenue actually make LESS total profit than before.
Not less margin. Less total dollars in the bank.
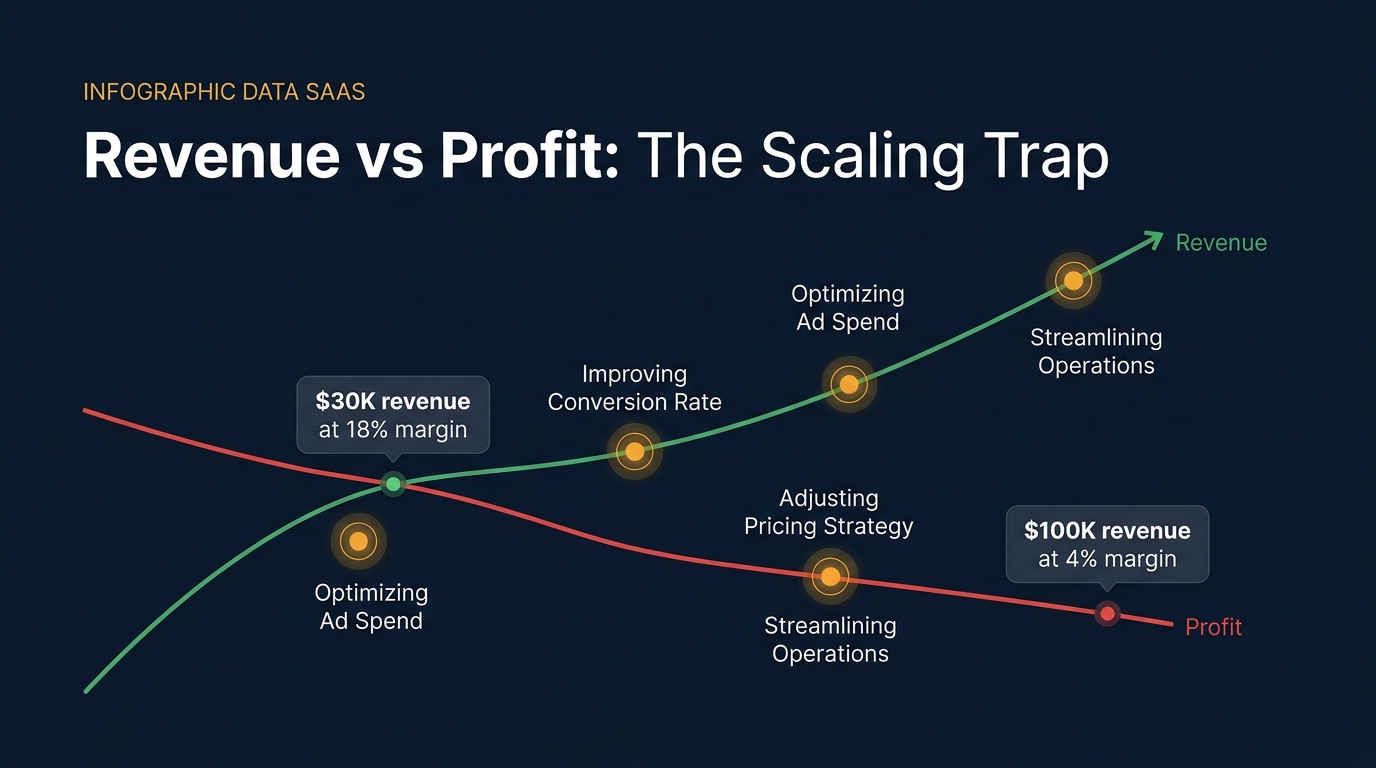
I have seen it over and over. A store does $30K/month with 18% net margin ($5,400 profit). They scale to $100K/month and their margin drops to 4% ($4,000 profit). They tripled revenue and lost $1,400 in monthly profit.
This is not bad luck. It is a predictable pattern with predictable causes and — most importantly — predictable solutions.
The 5 Margin Killers of Growth
Every ecommerce store that scales hits the same wall. The costs that were manageable at $30K become crushing at $100K. Here is exactly what happens:
1. Ad Spend Efficiency Drops (The Diminishing Returns Curve)
At $2K/month ad spend, you are targeting your best audience. Your ROAS might be 5x or 6x. But when you scale to $15K/month, you are reaching colder audiences. ROAS drops to 2.5x or 3x.
The math problem:
- At $30K revenue, $2K ads, 6x ROAS → $28K net of ads
- At $100K revenue, $15K ads, 3x ROAS → $85K net of ads
- Ad spend went from 6.7% to 15% of revenue
That 8.3 percentage point shift? On $100K revenue, that is $8,300/month less profit.
2. Shipping Costs Increase (The Volume Discount Myth)
You would think more volume = cheaper shipping. Sometimes yes. But scaling often means:
- More zones (you ship farther, not just locally)
- More heavy/oversized items
- More split shipments
- More expedited shipping demands
Real numbers:
- At $30K/month: avg shipping cost $4.50/order, 400 orders → $1,800
- At $100K/month: avg shipping cost $6.20/order, 1,200 orders → $7,440
- Shipping went from 6% to 7.4% of revenue
3. Return Rate Climbs
This one catches everyone off guard. As you reach colder audiences through paid ads, your return rate goes up. People who found you organically are more committed. People from a Facebook ad are more likely to return.
Industry data:
- Organic customers: 8-12% return rate
- Paid customers: 15-25% return rate
- As you scale, paid becomes a bigger share → blended rate climbs
At $30K/month with 10% returns, you eat $3K in return costs. At $100K/month with 18% returns, that is $18K — and each return costs $35-55 in processing (from our refund cost analysis).
4. Team and Tool Costs Jump in Steps
You cannot just hire 0.3 of a person. At $30K/month, you do everything yourself. At $60K, you need a VA ($1,500-$2,000/month). At $100K, you need a customer service person ($3,000-$4,000/month) plus a fulfillment coordinator plus upgraded tools.
These are step-function costs that hit all at once:
| Revenue | Team cost/month | % of revenue |
|---|---|---|
| $30K | $0 (solo) | 0% |
| $60K | $2,000 (1 VA) | 3.3% |
| $100K | $7,000 (2-3 people) | 7% |
| $200K | $18,000 (5-6 people) | 9% |
5. COGS Per Unit Rises (The Inventory Trap)
Scaling means more SKUs, more variants, and faster restock cycles. This leads to:
- Smaller batch orders (to avoid dead stock) at higher per-unit cost
- More rush orders when popular items run out
- More damaged/lost inventory
- More supplier minimum order quantities for new items
The Profitable Scaling Framework
Now that you know what kills margins, here is how to scale without the death spiral:
Step 1: Know Your Breakeven Scaling Point
Before spending a dollar more on ads, calculate your floor margin — the lowest margin where scaling still makes sense.
Floor margin formula:
Floor Margin = Fixed Costs / Revenue + Minimum Acceptable Profit %
Example:
- Fixed costs: $8,000/month (rent, tools, salaries)
- Target revenue: $100K/month
- Minimum acceptable profit: 10%
Floor Margin = ($8,000 / $100,000) + 10% = 8% + 10% = 18%
If your variable margin (after COGS, shipping, ads, fees) drops below 18%, you are scaling at a loss.
Step 2: Scale Ad Spend in Tiers, Not Jumps
Do not go from $2K to $15K in ad spend overnight. Scale in 20-30% weekly increments and track ROAS at each level:
| Week | Ad Spend | ROAS | Revenue | Cost per Dollar of Revenue |
|---|---|---|---|---|
| 1 | $2,000 | 5.5x | $11,000 | $0.18 |
| 2 | $2,600 | 5.2x | $13,520 | $0.19 |
| 3 | $3,380 | 4.8x | $16,224 | $0.21 |
| 4 | $4,400 | 4.3x | $18,920 | $0.23 |
When cost per dollar of revenue exceeds your floor margin, stop scaling ads and focus on creative refresh or new channels.
Step 3: Lock In Supplier Terms Before You Scale
This is the most overlooked step. Before you double revenue, negotiate:
- Volume pricing tiers (10%, 20%, 50% more units)
- Net-30 or Net-60 payment terms (this is cash flow gold)
- Guaranteed lead times
- Returns/defect allowances
A 5% COGS reduction on $100K revenue is $5,000/month straight to profit.
Step 4: Automate Before You Hire
Every team member costs $2K-$5K/month. Before hiring, check if automation handles 80% of the work:
- Customer service: AI chatbot + templated responses (Gorgias, Tidio)
- Order fulfillment: 3PL integration (ShipBob, Deliverr)
- Inventory: Reorder point automation
- Email marketing: Automated flows (Klaviyo, Omnisend)
The goal: delay your next hire by 3-6 months through automation.
Step 5: Monitor the 5 Scaling KPIs Weekly
| KPI | Formula | Danger Zone |
|---|---|---|
| Contribution Margin | (Revenue - Variable Costs) / Revenue | Below 20% |
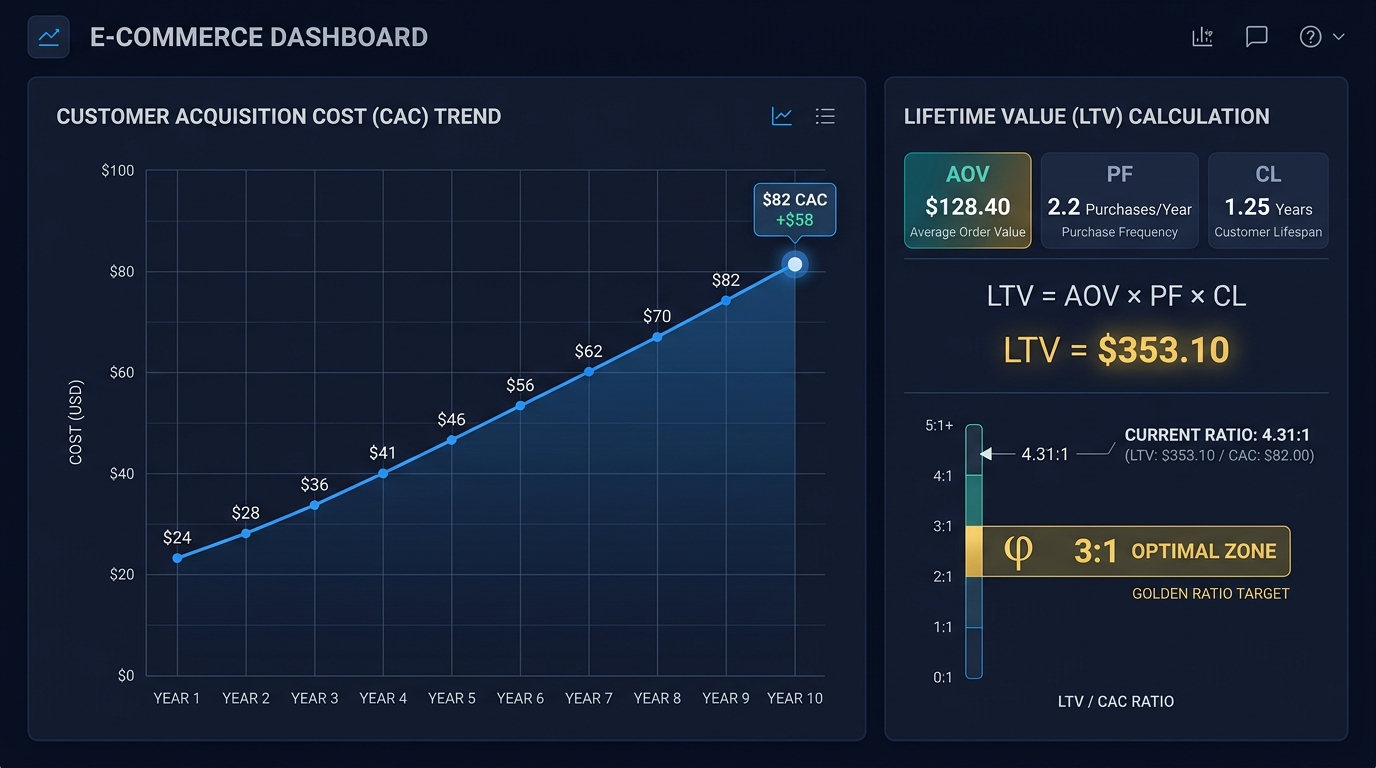
| CAC Payback | CAC / Average Monthly Revenue per Customer | Above 4 months |
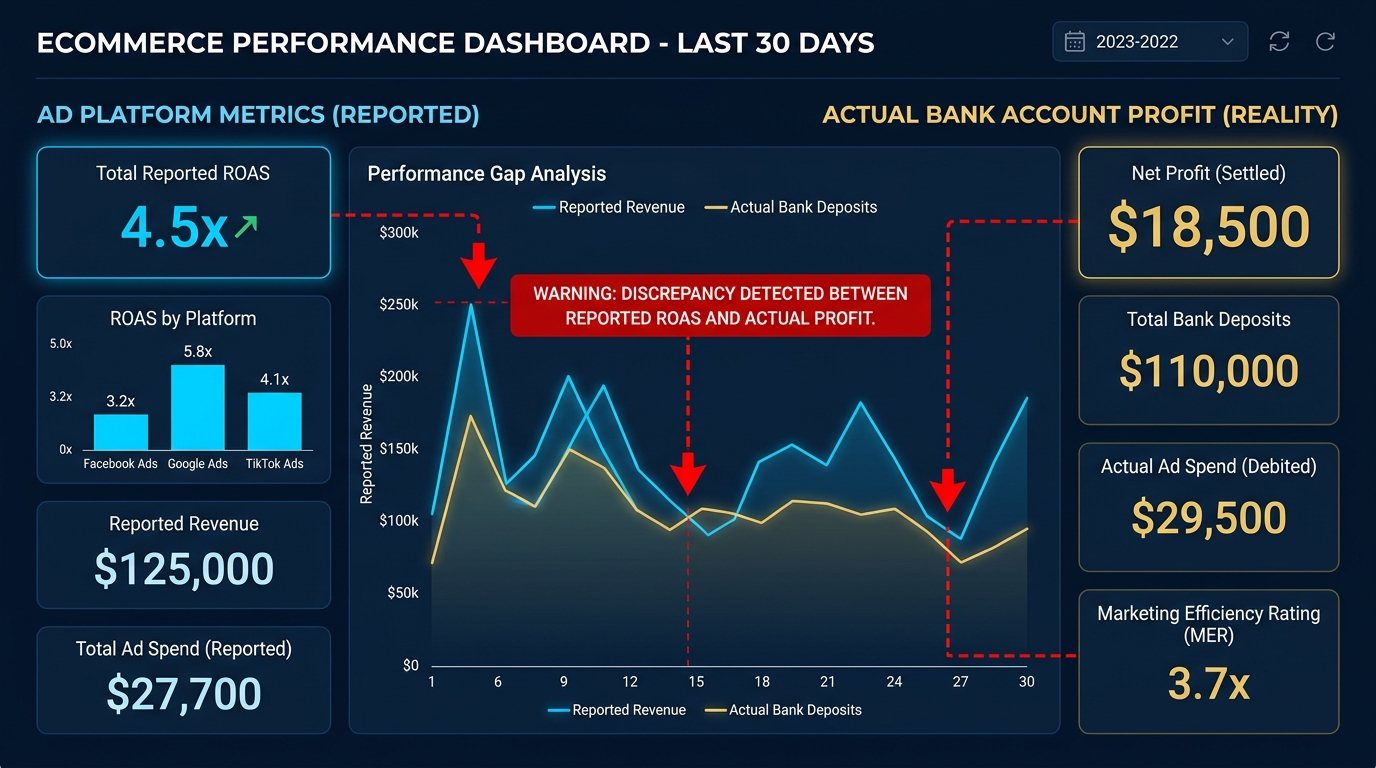
| Blended ROAS | Total Revenue / Total Ad Spend | Below 3x |
| Return Rate | Returns / Total Orders | Above 15% |
| Cash Conversion Cycle | DIO + DSO - DPO | Above 45 days |
If two or more KPIs hit the danger zone, pause scaling and fix the leaks first.
Real Case: $30K → $100K Without Margin Loss
A skincare brand client went from $30K to $100K/month in 8 months. Here is what they did differently:
Month 0 (Before scaling):
- Revenue: $30K, Margin: 22%, Profit: $6,600
- 85% organic traffic, 15% paid
What they did:
- 1Negotiated COGS down 12% with supplier (committed to 6-month order)
- 2Switched from USPS to a 3PL — shipping dropped from $5.80 to $4.10/order
- 3Scaled ads 25%/week, paused at any ROAS below 3.5x
- 4Built email flows that generated 30% of revenue (free traffic)
- 5Hired ONE person (customer service + fulfillment) at $80K instead of three specialists
Month 8 (After scaling):
- Revenue: $102K, Margin: 19%, Profit: $19,380
- 55% organic/email, 45% paid
Margin dropped only 3 points (22% → 19%), but total profit tripled ($6,600 → $19,380).
The Bottom Line
Scaling is not about growing revenue. It is about growing PROFIT. Revenue is vanity, profit is sanity.
Before you scale:
- 1Know your floor margin
- 2Fix your unit economics
- 3Lock in supplier terms
- 4Automate first, hire second
- 5Monitor weekly, not monthly
Upload your Shopify data to Okiela (free, 3 analyses/month) and see your real margins before and after scaling. The founders who scale profitably are the ones who know their numbers cold.
Find the hidden profit leaks draining your store.
Send one order export. Get your 3 biggest profit leaks back within 48 hours.
Request a free Profit Leakage AuditFree, founder-run, no pitch unless you ask. Every number labeled Verified or Estimated. Remove customer PII before upload.
Enjoyed this article?
Get weekly profit optimization tips and Okiela product news delivered to your inbox.
No spam. Unsubscribe anytime.
Nguyen Tuan Dai
Founder & CEO, Okiela
FP&A analyst building ecommerce tools on the side. Helping founders see their real numbers since 2025.