How to Know If Your Ads Are Actually Profitable (Not Just "Working")
Your ad manager says ROAS is 3x. Your bank account disagrees. Here is the simple math that tells you whether your ad spend is actually making you money — or quietly draining it.
Nguyen Tuan Dai
Founder & CEO, Okiela
Key Takeaways
- 1ROAS only measures revenue per ad dollar — it ignores COGS, shipping, fees, and returns
- 2Breakeven ROAS = 1 / Variable Margin %. Most Shopify brands need 2.5-3.3x ROAS just to break even
- 3A 3.3x ROAS campaign generated only $2,100 actual profit from $8,000 ad spend after all costs
- 4MER (Total Revenue / Total Marketing Spend) is more honest than per-campaign ROAS
- 5Test: pause your most expensive channel for 2 weeks and see if total revenue drops by the expected amount
Table of Contents (8 sections)
- Why ROAS Lies to You
- The Breakeven ROAS Formula
- Real Example: The "Profitable" Campaign That Lost $4,200
- MER: The Metric That Actually Tells the Truth
- The "What If I Cut This Channel" Test
- 3 Steps to Figure Out Your Real Ad Profitability
- Why Your Agency Probably Will Not Tell You This
- What Okiela Shows You
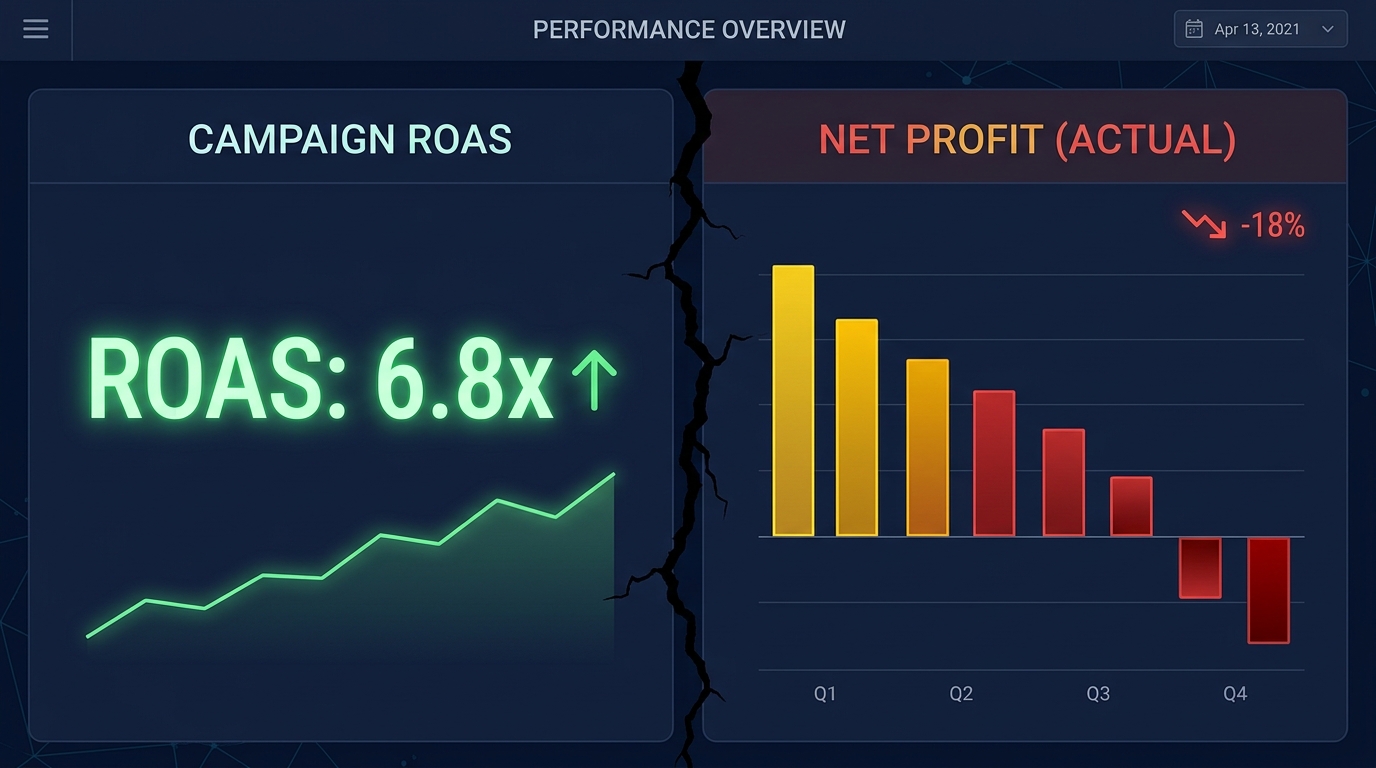
A friend of mine runs a skincare brand on Shopify. She showed me her Meta Ads dashboard last month, grinning: "Look — 3.2x ROAS. We are crushing it."
I asked her to open her bank account. She went quiet.
Her Shopify revenue was up 40% year over year. Her bank balance was down. Not by a little. By a lot.
This is the most common trap in ecommerce right now. Your ad platform says one thing. Your cash says another. And the gap between them is where businesses silently die.
Why ROAS Lies to You
Let me be blunt about this. ROAS — Return on Ad Spend — is the most dangerous metric in ecommerce when used alone.
Here is why.
ROAS only measures one thing: how much revenue came from every dollar of ad spend. A 3x ROAS means you spent $1 on ads and generated $3 in revenue.
Sounds great. But revenue is not profit. Not even close.
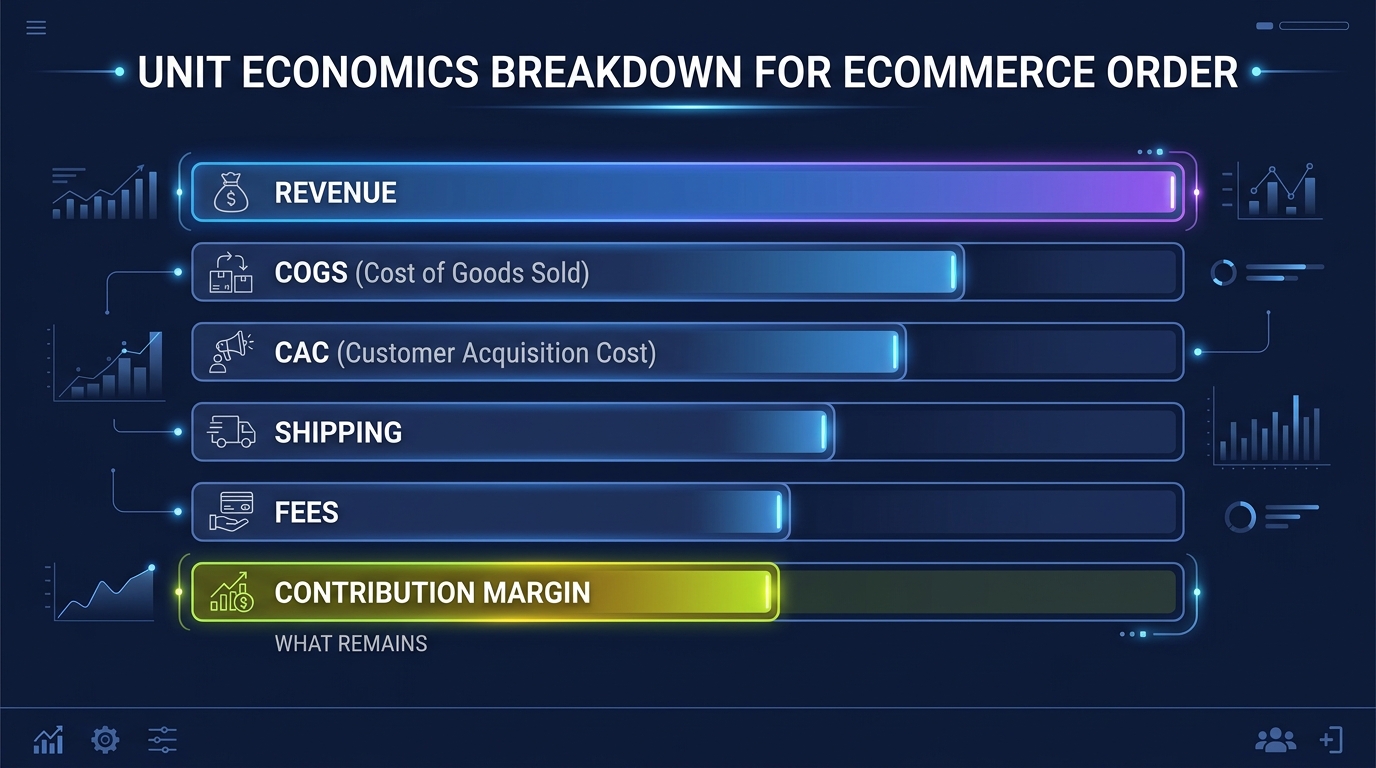
That $3 in revenue still has to pay for:
- Product cost (COGS): roughly $1.20 (40%)
- Shipping: $0.35
- Payment processing: $0.12
- Returns and refunds: $0.24
- Platform fees: $0.06
After all those costs, that $3 in revenue becomes about $1.03 in gross margin. You spent $1 on ads to make $1.03 in margin. Your "3x ROAS" campaign made you 3 cents per dollar.
Three cents. That is what "crushing it" actually looks like when you count all the costs.
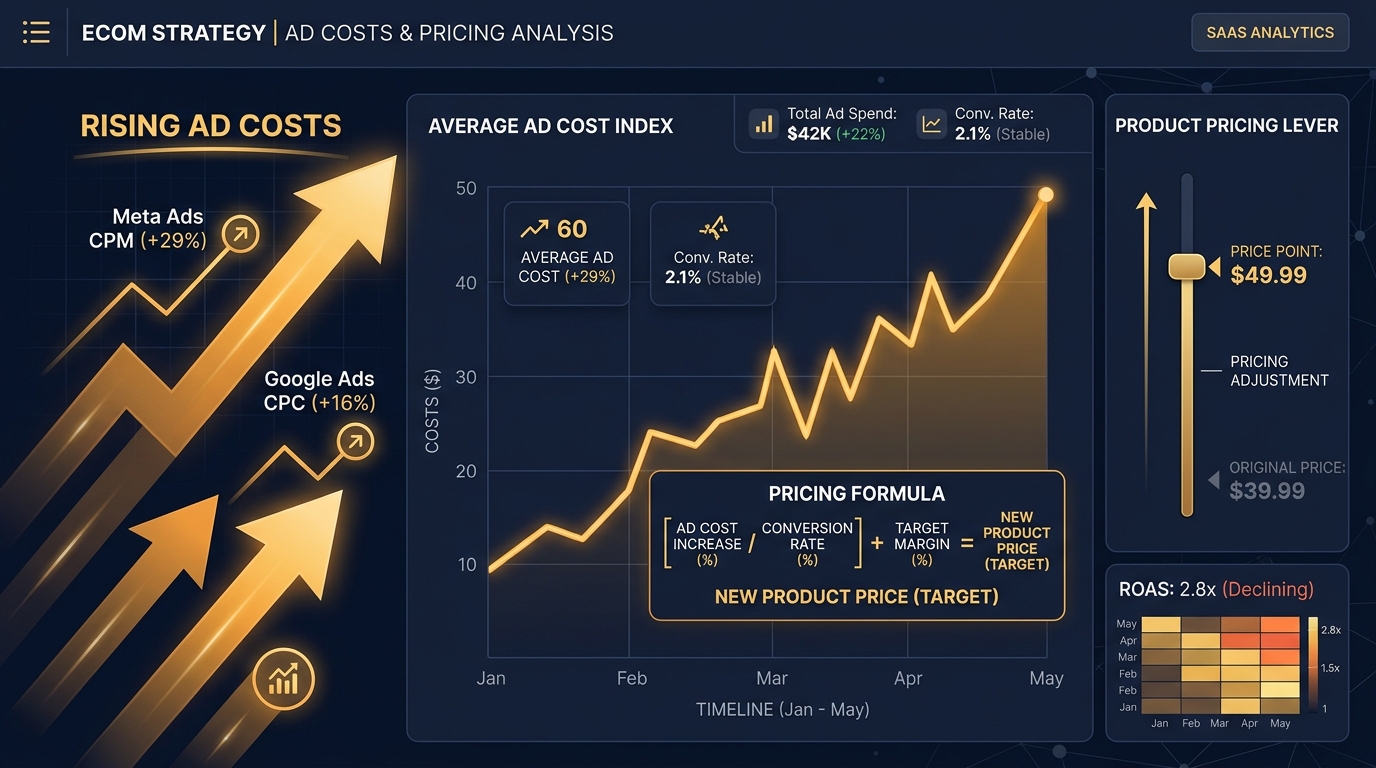
The Breakeven ROAS Formula
Here is the formula that changes everything. I wish someone had shown me this earlier:
Breakeven ROAS = 1 / (Average Gross Margin % after all variable costs)
If your average gross margin after COGS, shipping, fees, and returns is 35%, then:
Breakeven ROAS = 1 / 0.35 = 2.86x
Any ROAS below 2.86x means you are losing money on every ad dollar. Any ROAS above 2.86x means you are making money.
Now the problem becomes obvious. Most Shopify brands have a gross margin between 30-40% after all variable costs. That means breakeven ROAS is somewhere between 2.5x and 3.3x.
So when your ad manager celebrates a 3x ROAS, they might be celebrating a campaign that barely breaks even — or one that is actually losing money after you account for returns and processing fees they never included.
Real Example: The "Profitable" Campaign That Lost $4,200
Here are actual numbers from a store I analyzed recently:
Monthly ad spend: $8,000 across Meta and Google
Revenue attributed to ads: $26,400 (3.3x ROAS)
Orders from ads: 352
Per-order economics:
| Line Item | Per Order | Monthly Total |
|---|---|---|
| Revenue | $75.00 | $26,400 |
| COGS (landed) | -$30.00 | -$10,560 |
| Shipping (net) | -$5.50 | -$1,936 |
| Payment fees | -$2.48 | -$873 |
| Return cost (12% rate) | -$4.20 | -$1,478 |
| Platform fees | -$1.50 | -$528 |
| Margin before ads | $31.32 | $11,025 |
Margin before ads: $11,025
Ad spend: $8,000
Actual profit from ad-driven sales: $3,025
Wait — $3,025 profit from $8,000 in ad spend? That is a 37.8% return on investment. Not terrible, right?
But here is the thing nobody talks about. Those 352 orders also generated:
- 42 returns ($1,478 in processing costs already included)
- 6 chargebacks ($480 in fees plus the lost merchandise)
- Customer support tickets: 89 emails (estimated cost: $445)
After the hidden costs: $3,025 - $480 - $445 = $2,100 actual profit
From $8,000 in ad spend. A 26% return. Not a disaster, but nowhere near what the 3.3x ROAS headline suggested.
And this is for a GOOD month. One bad month — a higher return rate, a spike in CPMs — and this campaign is underwater.
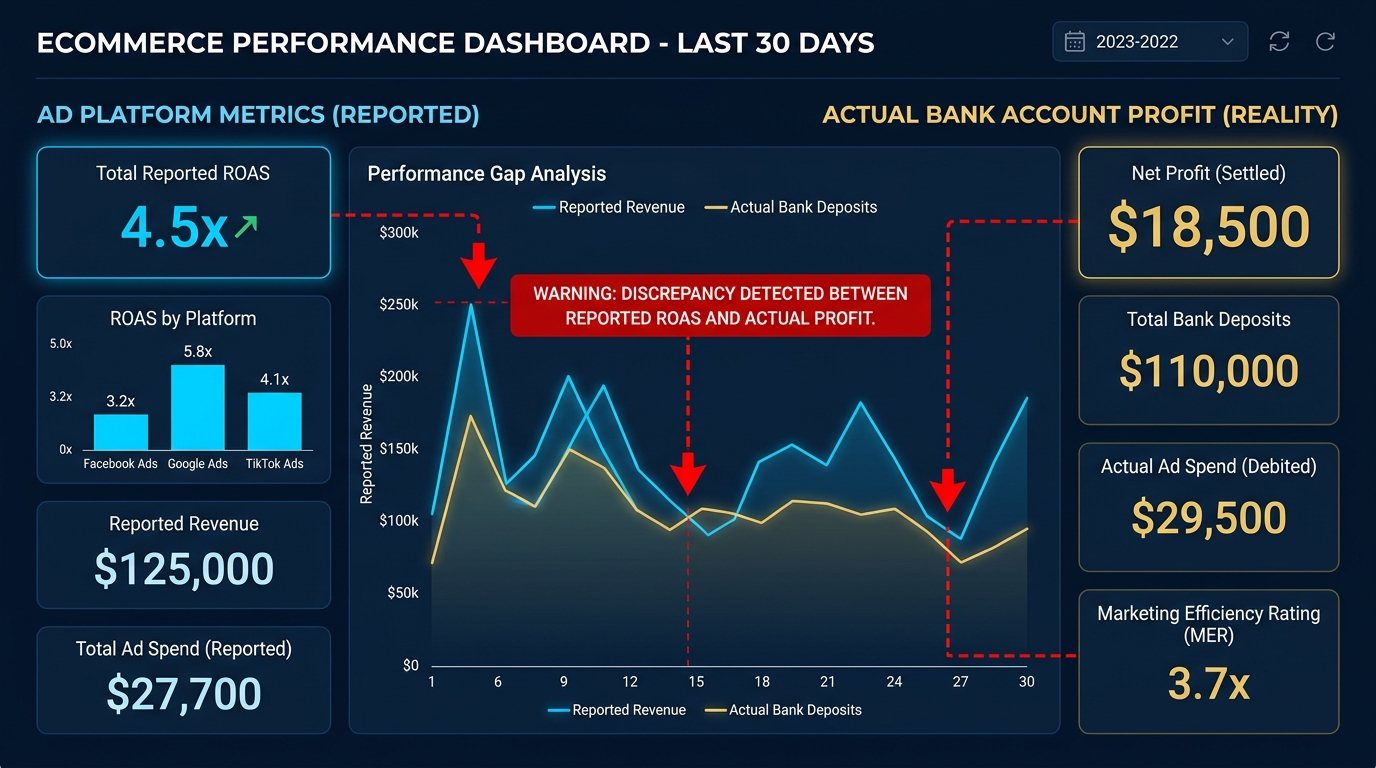
MER: The Metric That Actually Tells the Truth
Instead of ROAS per campaign, track your Marketing Efficiency Ratio:
MER = Total Revenue / Total Marketing Spend
MER looks at your entire business, not just ad-attributed revenue. It includes organic sales, email revenue, direct traffic — everything.
Why is this better? Because ads do not work in isolation. A customer might see your Meta ad, then Google your brand, then buy through direct traffic. The Meta ad gets zero attribution credit, but it started the journey.
MER captures all of that. It tells you: for every dollar I spend on marketing, how much total revenue does my business generate?
Healthy MER benchmarks for Shopify DTC:
- Below 3x: You are spending too much on marketing relative to total revenue
- 3x to 5x: Sustainable range for growth-stage brands
- 5x to 8x: Efficient — your organic channels are strong
- Above 8x: Either very efficient or you are underinvesting in growth
One of the prospects I spoke with recently put it perfectly: "Every platform is claiming the same conversions and I have no real bird's eye view of my actual profit."
That is the MER problem. Individual ROAS numbers per platform overlap and over-claim. MER cuts through all of that.
The "What If I Cut This Channel" Test
Here is a practical exercise that takes 10 minutes and can save you thousands.
Pick your most expensive ad channel. Usually Meta or Google. Now ask:
"If I turned off this channel tomorrow, would my total revenue drop by more than the ad spend I would save?"
For my skincare brand friend, she was spending $5,000/month on TikTok ads. Her TikTok-attributed revenue was $12,000. Looks like a clear winner — 2.4x ROAS.
But when she paused TikTok for two weeks as a test, her total revenue only dropped by $3,200 — not the $6,000 she expected. Why? Because many of those TikTok "conversions" were customers who would have bought anyway through organic search or email.
Her real return from TikTok was not $12,000. It was closer to $6,400. That changes the ROI calculation entirely.
You cannot know this from an ad dashboard. You can only know it by testing.
3 Steps to Figure Out Your Real Ad Profitability
Step 1: Calculate Your True Variable Margin
Export your last 90 days of Shopify data. For every order, calculate:
Revenue - COGS - Shipping - Payment Fees - Return Costs - Platform Fees = Variable Margin
Divide total variable margin by total revenue. That is your variable margin percentage.
If you do not have COGS per SKU, use 40% as a starting estimate. It is wrong, but it is better than ignoring COGS entirely.
Step 2: Calculate Your Breakeven ROAS
Take your variable margin percentage from Step 1. Plug it in:
Breakeven ROAS = 1 / Variable Margin %
Now compare every ad campaign against this number. Anything below breakeven is losing money. Anything above is contributing to profit.
Step 3: Track Your Monthly MER
Total up ALL marketing spend (ads, influencers, agency fees, email platform costs). Divide total revenue by that number.
Track this monthly. If MER is trending down, you are getting less efficient. If it is trending up, your organic channels are growing faster than your paid spend.
The action for this week: Export your numbers, calculate breakeven ROAS, and check how many of your current campaigns are actually above it. Most founders who do this for the first time discover that 30-50% of their ad spend is below breakeven.
Why Your Agency Probably Will Not Tell You This
Let me be honest about something uncomfortable. Most ad agencies are optimized to show you good ROAS numbers. That is what they get judged on. That is what keeps you paying them.
Nobody is lying. But ROAS is just one part of the picture. Your agency is not tracking your COGS, your return rates, your shipping costs. They cannot calculate whether a 3x ROAS campaign is profitable or not because they do not have the data.
This is not their failure. It is a gap in the system. Attribution tools tell you where clicks come from. Profit tools tell you where money goes. You need both.
What Okiela Shows You
When you upload your Shopify data to Okiela, the profit dashboard calculates your true margin per order, per SKU, and per channel — including all the costs your ad manager never sees.
You get:
- Actual contribution margin per order (after all variable costs)
- Channel-level profit breakdown (not just revenue)
- Your real breakeven ROAS calculated from your actual margins
- AI recommendations on which campaigns to scale and which to cut
Every number is auditable. You can click any metric and see exactly how it was calculated, what data source it came from, and what assumptions were made.
No black boxes. No "trust us" attribution models. Just your numbers, calculated transparently.
Free plan includes 3 analyses per month. That is enough to check your numbers once a week and make better decisions about where your ad budget goes.
Because at the end of the day, the question is not "are my ads working?" The question is "are my ads making me money after everything is paid?" And right now, your ad dashboard cannot answer that question. Your bank account can. So can Okiela.
Find the hidden profit leaks draining your store.
Send one order export. Get your 3 biggest profit leaks back within 48 hours.
Request a free Profit Leakage AuditFree, founder-run, no pitch unless you ask. Every number labeled Verified or Estimated. Remove customer PII before upload.
Enjoyed this article?
Get weekly profit optimization tips and Okiela product news delivered to your inbox.
No spam. Unsubscribe anytime.
Nguyen Tuan Dai
Founder & CEO, Okiela
FP&A analyst building ecommerce tools on the side. Helping founders see their real numbers since 2025.