Unit Economics Per Order Explained Simply (The Only 6 Numbers You Need)
Unit economics sounds like a term from business school. It is actually just 6 numbers that tell you whether your store makes or loses money on every sale.
Nguyen Tuan Dai
Founder & CEO, Okiela
Key Takeaways
- 1Unit economics = how much you make or lose on each order after ALL costs
- 2Only 6 numbers: revenue per order, COGS, CAC, fulfillment, transaction fees, and contribution margin
- 3About 1 in 4 DTC stores have negative contribution margin when CAC is properly allocated
- 44 levers to fix it: raise prices, lower CAC, increase AOV, cut COGS
- 5A $17 improvement per order on 1,500 monthly orders = $25K/month more profit
Table of Contents (7 sections)
An investor asked a Shopify founder I know: "What are your unit economics?"
He panicked. He did not know what that meant. He said something about "40% margins" and the conversation moved on. He called me after, embarrassed, and asked: "What are unit economics? Am I supposed to know this?"
Yes. And it is way simpler than it sounds.
Unit economics is just: how much money do you make (or lose) on each order you fulfill?
That is it. No MBA required. Let me show you the 6 numbers and how to calculate them.
What "Unit Economics" Actually Means
Imagine your store fulfills one single order. A customer buys something, you ship it, and money moves around.
Unit economics is the story of that ONE order -- what came in, what went out, and what (if anything) was left.
If you make money on that one order after ALL costs, your unit economics are healthy. If you lose money, no amount of "scaling" will fix it. Scaling losses just creates bigger losses.
This is why investors ask about unit economics. They want to know if each transaction is fundamentally profitable. If it is not, more volume just means more bleeding.
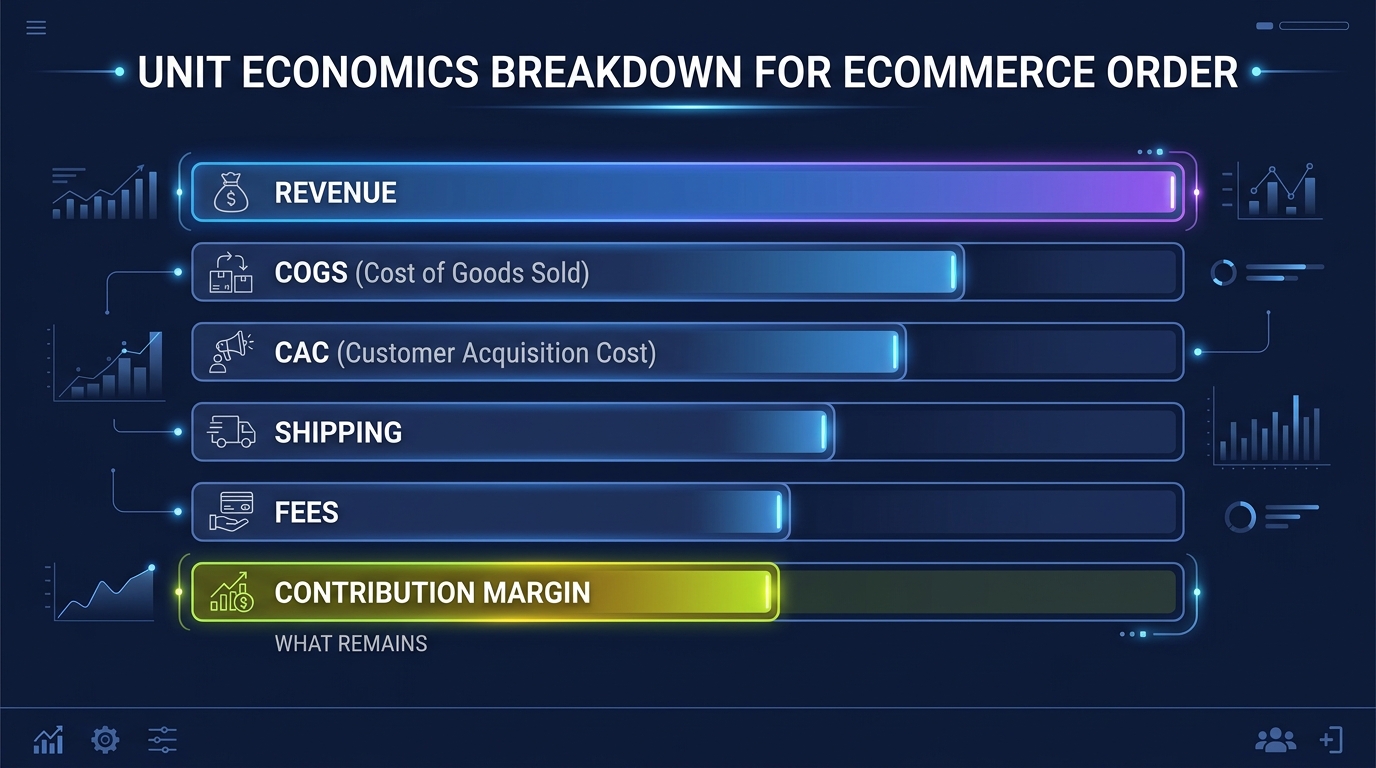
The 6 Numbers
Here they are. Six numbers. That is the entire framework.
Number 1: Average Revenue Per Order (ARPO)
What the customer actually pays, after discounts.
Not your list price. Not your "suggested retail." The actual average transaction value that hits your Shopify.
How to calculate: Total net revenue / Total orders (last 90 days)
Example: $127,500 / 1,500 orders = $85 ARPO
Pro tip: if you run a lot of discount codes, calculate ARPO both with and without discounts. The gap between the two numbers tells you how much margin your promotions are eating.
Number 2: Cost of Goods Sold Per Order (COGS)
What the products in that order cost you. Not just the manufacturer price -- the FULL landed cost:
- Product purchase price
- Inbound freight (manufacturer to your warehouse)
- Import duties and tariffs
- Packaging materials
- Quality control (reject rate baked in)
Example: Average COGS per order = $34 (40% of ARPO)
Most founders undercount COGS by 8-15% because they only track the purchase price and forget freight, duties, and packaging. If you are importing from overseas, your true landed cost is almost certainly higher than you think.
Number 3: Customer Acquisition Cost (CAC)
What you spent on marketing to get that customer to place an order.
How to calculate: Total marketing spend / Total new customers (last 90 days)
Include everything: Meta Ads, Google Ads, TikTok Ads, influencer payments, affiliate commissions, content creation costs.
Example: $45,000 ad spend / 1,000 new customers = $45 CAC
For repeat customers, CAC is effectively zero (they came back on their own). This is why customer retention is so powerful -- it zeroes out your biggest variable cost.
Number 4: Fulfillment Cost Per Order
Everything it costs to get the product from your warehouse to the customer's door:
- Picking and packing: $2-4 per order
- Shipping label: $6-12 (depending on weight/zone)
- Packaging materials: $0.50-2
- Shipping insurance (if offered): $0.50-1
Example: Average fulfillment cost per order = $11
Subtract whatever the customer paid for shipping:
- Shipping revenue collected: $5.99
- Net fulfillment cost: $5.01 per order
Number 5: Transaction Fees Per Order
Every payment has a cost:
- Shopify Payments: 2.9% + $0.30
- Third-party gateway surcharge: 0.5-2.0% (if applicable)
- Chargeback reserve: ~0.1%
On an $85 order through Shopify Payments:
- 2.9% x $85 + $0.30 = $2.77
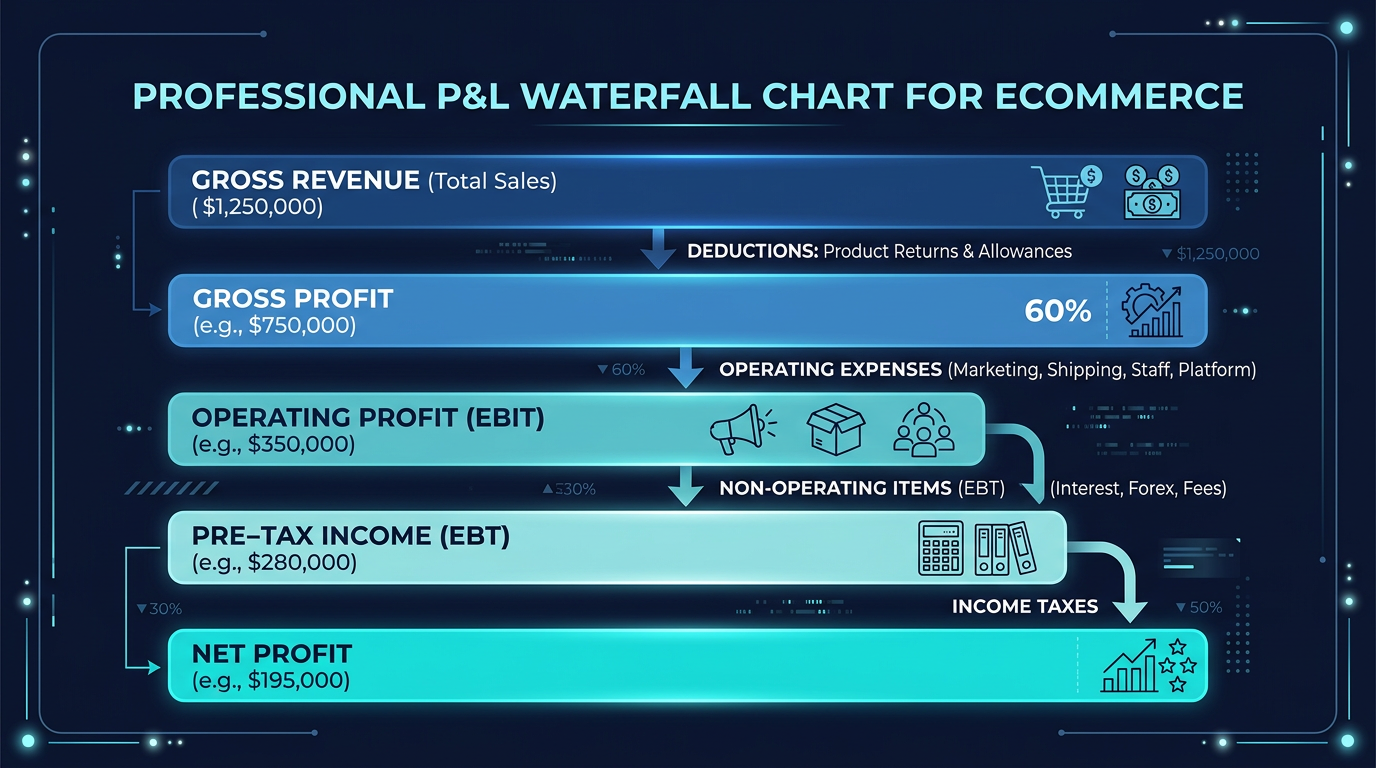
Number 6: Contribution Margin Per Order
This is the punchline. Take Number 1 and subtract Numbers 2 through 5:
| Line Item | Amount |
|---|---|
| Average Revenue Per Order | $85.00 |
| - COGS (landed) | -$34.00 |
| - CAC (allocated) | -$45.00 |
| - Net Fulfillment Cost | -$5.01 |
| - Transaction Fees | -$2.77 |
| Contribution Margin | -$1.78 |
Wait. Negative?
Yes. This hypothetical store is losing $1.78 on every single order. Not including fixed costs like Shopify plan, apps, team salary, or rent.
And this is more common than you think. I see it in about 1 in 4 stores I analyze when CAC is properly allocated.
Why Contribution Margin Is the Only Number That Matters
Gross margin tells you if your product pricing is viable. But contribution margin tells you if your BUSINESS is viable.
A store can have 60% gross margin and still lose money on every order if CAC and fulfillment costs are too high.
Healthy contribution margin benchmarks for DTC:
| Contribution Margin | What It Means |
|---|---|
| Above 25% | Excellent. Scale aggressively. |
| 15-25% | Healthy. Room to optimize. |
| 5-15% | Thin. One cost increase away from trouble. |
| 0-5% | Dangerous. Fix before scaling. |
| Negative | You are paying customers to buy from you. Stop scaling. |
How to Fix Negative Unit Economics
If your contribution margin is negative or dangerously thin, you have exactly four levers:
Lever 1: Raise Prices
A 10% price increase on an $85 product adds $8.50 per order straight to contribution margin. If volume drops less than 10%, you are better off.
Most stores can raise prices 5-10% with less than 3% volume impact -- especially on products with strong reviews and limited direct competition.
Lever 2: Lower CAC
Find cheaper acquisition channels. Email marketing has near-zero marginal CAC. SEO takes time but drives perpetual free traffic. Referral programs typically cost $10-15 per customer vs $45+ on paid ads.
Even reducing CAC by $10 per order turns our example from -$1.78 to +$8.22. That is the power of the CAC lever.
Lever 3: Increase Average Order Value
Bundles, upsells, and free-shipping thresholds all push AOV higher. If you can move AOV from $85 to $100 without increasing CAC, your contribution margin jumps because most costs are fixed per order (shipping, payment processing) while revenue scales.
The best founders I know obsess over AOV more than conversion rate.
Lever 4: Cut COGS
Negotiate with suppliers for volume discounts. Switch to a cheaper freight forwarder. Reduce packaging costs. Even $2 per unit saved across 1,500 monthly orders is $3,000/month back in your pocket.
Real Example: Fixing a Store From -$2 to +$15 Per Order
| Before Fix | After Fix | Change |
|---|---|---|
| Price: $85 | Price: $94 (+10.6%) | +$9 revenue |
| CAC: $45 | CAC: $35 (added email + referral) | -$10 cost |
| Fulfillment: $11 | Fulfillment: $9.50 (negotiated carrier) | -$1.50 cost |
| COGS: $34 | COGS: $32 (volume discount) | -$2 cost |
| CM: -$1.78 | CM: +$15.43 | +$17.21 per order |
Monthly impact: 1,500 orders x $17.21 improvement = $25,815/month more profit.
Same store. Same products. Same customer base. Just better math.
How to Check Your Unit Economics Right Now
You can do this in a spreadsheet. Or you can upload your Shopify export to Okiela and see all 6 numbers per order (and per SKU) in 30 seconds.
The profit engine automatically allocates ad spend, shipping gaps, and payment fees to every order. You see contribution margin per order AND per product -- so you know exactly which SKUs have healthy unit economics and which ones are underwater.
The free plan includes 3 analyses per month. Start with your last 3 months of data and look at the contribution margin column. The number might surprise you.
The One Rule
Here is the simplest mental model for unit economics:
If you would not be happy fulfilling your next 100 orders at your current per-order profit, something needs to change.
Would you happily fulfill 100 orders at $15 profit each ($1,500 total)? Probably yes.
Would you happily fulfill 100 orders at -$2 each (losing $200 total)? Obviously not.
That is unit economics. It is not complicated. It is just honest.
Find the hidden profit leaks draining your store.
Send one order export. Get your 3 biggest profit leaks back within 48 hours.
Request a free Profit Leakage AuditFree, founder-run, no pitch unless you ask. Every number labeled Verified or Estimated. Remove customer PII before upload.
Enjoyed this article?
Get weekly profit optimization tips and Okiela product news delivered to your inbox.
No spam. Unsubscribe anytime.
Nguyen Tuan Dai
Founder & CEO, Okiela
FP&A analyst building ecommerce tools on the side. Helping founders see their real numbers since 2025.