How to Read an Ecommerce P&L If You Have Zero Finance Background
P&L statements look intimidating. They do not have to be. Here is how to read yours in 10 minutes -- explained like a friend, not a textbook.
Nguyen Tuan Dai
Founder & CEO, Okiela
Key Takeaways
- 1A P&L has 5 simple chapters: Gross Revenue, Net Revenue, Gross Profit, Contribution Margin, Net Profit
- 2The 3 numbers that matter: Gross Margin (55-70%), Contribution Margin (20%+), Net Profit (10-20%)
- 3Contribution Margin is the single most important metric -- it tells you if scaling works
- 4Net Revenue (after returns + discounts) is the real top line, not gross revenue
- 5A weekly 10-minute P&L review prevents costly blind spots
Table of Contents (10 sections)
- What a P&L Actually Is
- Chapter 1: Gross Revenue (The Top Line)
- Chapter 2: Net Revenue (What You Actually Collected)
- Chapter 3: Gross Profit (After Product Costs)
- Chapter 4: Contribution Margin (After Variable Costs)
- Chapter 5: Net Profit (What You Actually Keep)
- The Complete P&L on One Page
- The 3 Numbers That Matter Most
- How Okiela Shows You This Automatically
- The Weekly P&L Habit
Let me guess. Someone told you "you need to understand your P&L." You Googled it, found 47 articles with words like "amortization," "accrual basis," and "EBITDA." You closed the tab.
I get it. Finance jargon is designed to make simple things sound complicated. But here is the thing: a P&L is literally just a list of where your money came from and where it went. That is it.
No MBA required. Let me walk you through it the way I wish someone had walked me through it when I started.
What a P&L Actually Is
P&L stands for Profit and Loss statement. Some people call it an Income Statement. Same thing.
Think of it as a story. It starts with "You made $X in sales" and ends with "You kept $Y in actual profit." Everything in between is the story of where the money went.
For an ecommerce store, there are only 5 chapters in this story. Let me show you each one.
Chapter 1: Gross Revenue (The Top Line)
This is the total dollar amount of everything you sold. Before any deductions, refunds, or costs. Just the raw sales number.
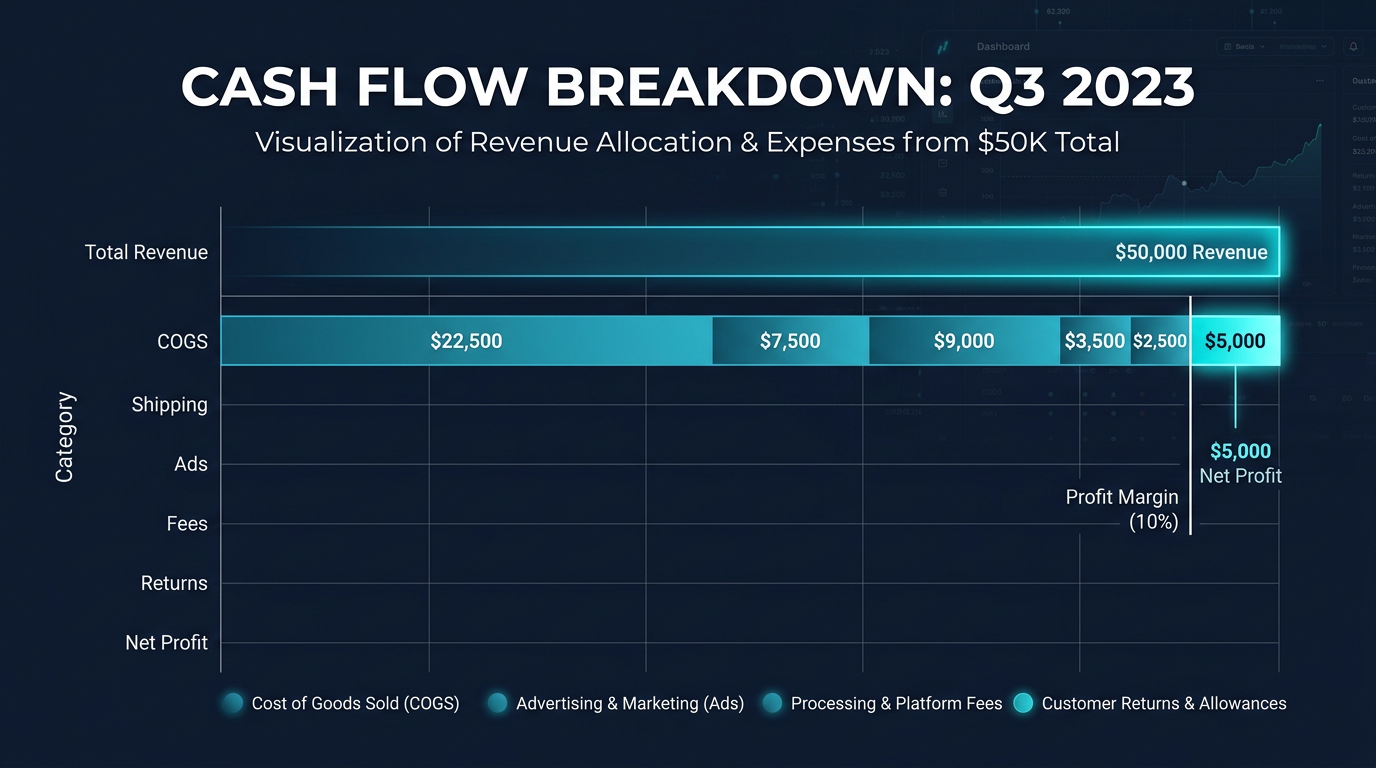
If your Shopify dashboard says "$50,000 in sales this month" -- that is your Gross Revenue.
Example: $50,000
This number feels good. It is the number you want to screenshot and post on Twitter. But it is also the most misleading number in your entire business. Because a LOT of that $50K belongs to other people.
Chapter 2: Net Revenue (What You Actually Collected)
Gross Revenue minus returns, refunds, and discounts.
- Gross Revenue: $50,000
- Returns and refunds: -$4,000 (8% return rate)
- Discounts given: -$3,500 (the "SPRING15" and "VIP20" codes)
- Net Revenue: $42,500
See? You did not actually "make" $50K. You collected $42,500. The other $7,500 went back to customers or was given away as discounts.
This is the number you should actually be using for all your other calculations. Not the $50K.
Chapter 3: Gross Profit (After Product Costs)
Net Revenue minus the cost of the products you sold (COGS -- Cost of Goods Sold).
COGS is what you paid for the actual product: the manufacturer price, inbound shipping, tariffs, packaging. Everything it cost to get that product sitting in your warehouse ready to sell.
- Net Revenue: $42,500
- COGS: -$17,000 (40% of net revenue)
- Gross Profit: $25,500 (60% gross margin)
Gross Profit tells you one thing: is your product pricing viable? If your gross margin is below 50%, your pricing might be too low or your COGS might be too high. Most healthy ecommerce brands target 55-70% gross margin.
What to do with this number: If gross margin is below 50%, focus on pricing or supplier negotiation BEFORE anything else. You cannot fix downstream costs if the product itself is priced wrong.
Chapter 4: Contribution Margin (After Variable Costs)
This is where it gets real. Gross Profit minus all the variable costs -- the costs that go up and down with each order:
- Shipping costs: -$5,000
- Payment processing fees: -$1,500
- Return processing costs: -$1,200
- Ad spend: -$7,500
- Contribution Margin: $10,300 (20.6% of net revenue)
Contribution Margin tells you: can I scale this profitably?
If your contribution margin is above 20%, you have room to grow. Below 15%, scaling will only make the problem bigger. Below 10%, you are dangerously close to losing money.
This is the single most important number in your P&L. Not revenue. Not gross margin. Contribution margin. Because it tells you the truth about whether your business model works at scale.
What to do with this number: If contribution margin is below 20%, identify the biggest variable cost (usually ad spend or shipping) and optimize it first.
Chapter 5: Net Profit (What You Actually Keep)
Contribution Margin minus all fixed costs -- the costs that exist regardless of how many orders you get:
- Shopify plan: -$105
- App subscriptions: -$500
- Team/freelancers: -$3,000
- Software tools: -$200
- Net Profit: $6,495 (13.0% of net revenue)
Net Profit is the money that is actually yours. After everyone else has been paid -- suppliers, shipping carriers, ad platforms, software companies, freelancers -- this is what remains.
A healthy ecommerce store targets 10-20% net profit margin. Below 5% is survival mode. Negative means you are losing money (it happens more often than you think).
The Complete P&L on One Page
Here is the whole story for our example $50K store:
| Line | Amount | % of Gross Rev |
|---|---|---|
| Gross Revenue | $50,000 | 100% |
| - Returns & Refunds | -$4,000 | -8.0% |
| - Discounts | -$3,500 | -7.0% |
| Net Revenue | $42,500 | 85.0% |
| - COGS | -$17,000 | -34.0% |
| Gross Profit | $25,500 | 51.0% |
| - Shipping | -$5,000 | -10.0% |
| - Payment Processing | -$1,500 | -3.0% |
| - Return Processing | -$1,200 | -2.4% |
| - Ad Spend | -$7,500 | -15.0% |
| Contribution Margin | $10,300 | 20.6% |
| - Shopify + Apps | -$605 | -1.2% |
| - Team Costs | -$3,000 | -6.0% |
| - Other Fixed | -$200 | -0.4% |
| Net Profit | $6,495 | 13.0% |
That is your entire P&L. Five chapters. One page. No jargon.
The 3 Numbers That Matter Most
If you remember nothing else, remember these three:
1. Gross Margin -- is your product pricing viable? Target: 55-70%.
2. Contribution Margin -- can you scale profitably? Target: 20%+.
3. Net Profit Margin -- are you actually making money? Target: 10-20%.
If gross margin is low, fix your pricing or COGS.
If contribution margin is low, fix your ad spend or shipping.
If net profit is low, fix your fixed costs or grow revenue.
This is the decision framework. It is not more complicated than that.
How Okiela Shows You This Automatically
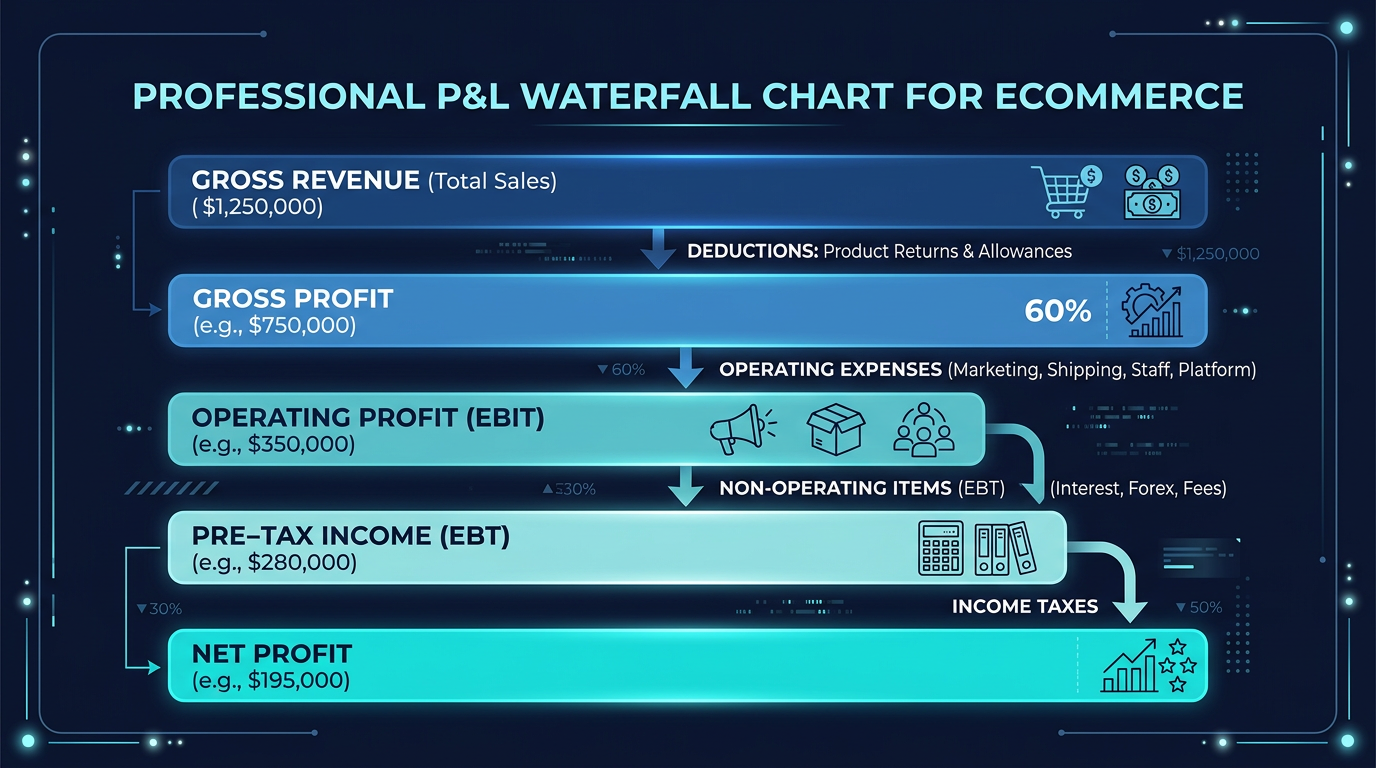
You do not have to build this P&L manually. Upload your Shopify export to Okiela and the 5D profit pipeline generates a complete profit waterfall in 30 seconds:
- Level 1 (GMV): Your gross revenue
- Level 2 (Net Revenue): After returns, discounts
- Level 3 (Gross Profit): After COGS
- Level 4 (Net Profit): After fees, shipping, ads
- Level 5 (True Profit): After EVERYTHING
Each level shows exactly how much money you lose at each step. You see the complete story of your money -- from the moment a customer pays to the moment profit (or loss) reaches your bank account.
The AI then tells you which step is leaking the most and what to do about it.
The Weekly P&L Habit
Here is my recommendation: every Monday morning, spend 10 minutes reviewing your P&L for the previous week. Not the month. The week.
Look at three things:
- 1Did gross margin change? (If so, a product price or COGS changed.)
- 2Did contribution margin change? (If so, ad spend or shipping costs shifted.)
- 3Is net profit on track for your monthly target?
That is it. 10 minutes. Every Monday.
The founders who do this make better decisions. Not because they are smarter. Because they have better information, more frequently.
Your P&L is not a scary finance document. It is a map of your money. Learn to read it, and you will never fly blind again.
Free plan on Okiela includes 3 profit analyses per month. Upload your data, see your profit waterfall, and learn exactly where your money is going. No finance degree required.
Find the hidden profit leaks draining your store.
Send one order export. Get your 3 biggest profit leaks back within 48 hours.
Request a free Profit Leakage AuditFree, founder-run, no pitch unless you ask. Every number labeled Verified or Estimated. Remove customer PII before upload.
Enjoyed this article?
Get weekly profit optimization tips and Okiela product news delivered to your inbox.
No spam. Unsubscribe anytime.
Nguyen Tuan Dai
Founder & CEO, Okiela
FP&A analyst building ecommerce tools on the side. Helping founders see their real numbers since 2025.