Why Chasing ROAS Is Making You Less Profitable (And What to Track Instead)
Your ad manager is celebrating 5x ROAS. Your bank account does not care. Here is why ROAS is the most misleading metric in ecommerce -- and the 3 numbers that actually matter.
Nguyen Tuan Dai
Founder & CEO, Okiela
Key Takeaways
- 1A product with 5x ROAS can lose money on every sale if margins are thin
- 2Track Contribution Margin After Ads (CMA) instead of ROAS for real profit visibility
- 3Calculate minimum profitable ROAS per SKU -- blanket targets are meaningless
- 4Email/SMS programs often generate more profit than paid ads at 0 acquisition cost
- 5The ROAS trap: competitors like BeProfit have been criticized for inflating ROAS by only counting attributed spend
Table of Contents (7 sections)
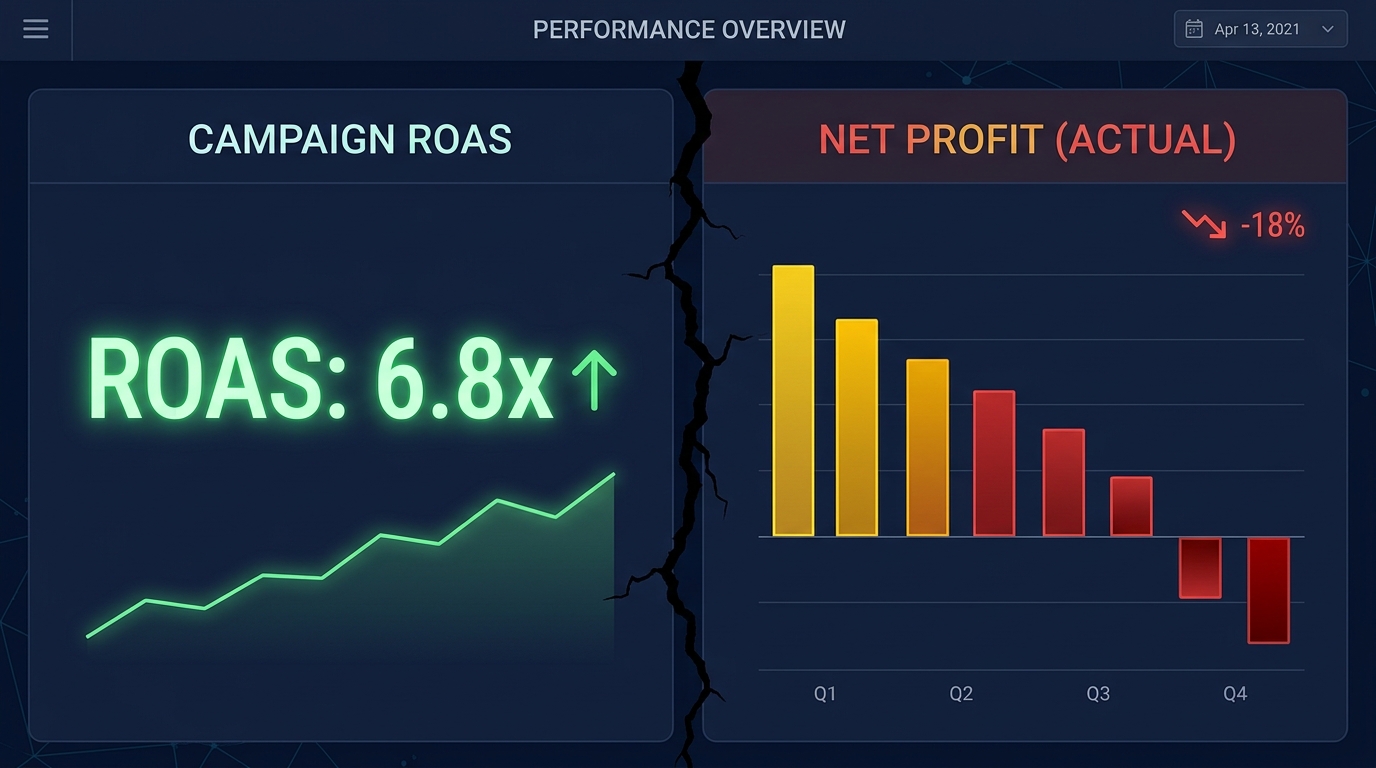
A founder showed me his Facebook Ads dashboard last month. Big grin. "Look at this. 5x ROAS. Crushing it."
I opened his Shopify reports. Then we did the math together.
His 5x ROAS campaign was generating a 6% net margin. After payment fees, shipping gaps, returns, and platform costs. Six percent. On $75K in monthly revenue, that is $4,500 in actual profit.
Then I showed him his email campaigns. Zero ad spend. 36:1 return. Those emails were generating $8,200/month in profit. From customers he already had.
His "crushing it" ad campaign was making HALF the profit of his $0 email program.
ROAS lied to him. And it is probably lying to you too.
What ROAS Actually Measures (And What It Misses)
ROAS = Revenue Generated / Ad Spend
That is it. Revenue divided by cost. It tells you how much revenue each dollar of advertising created.
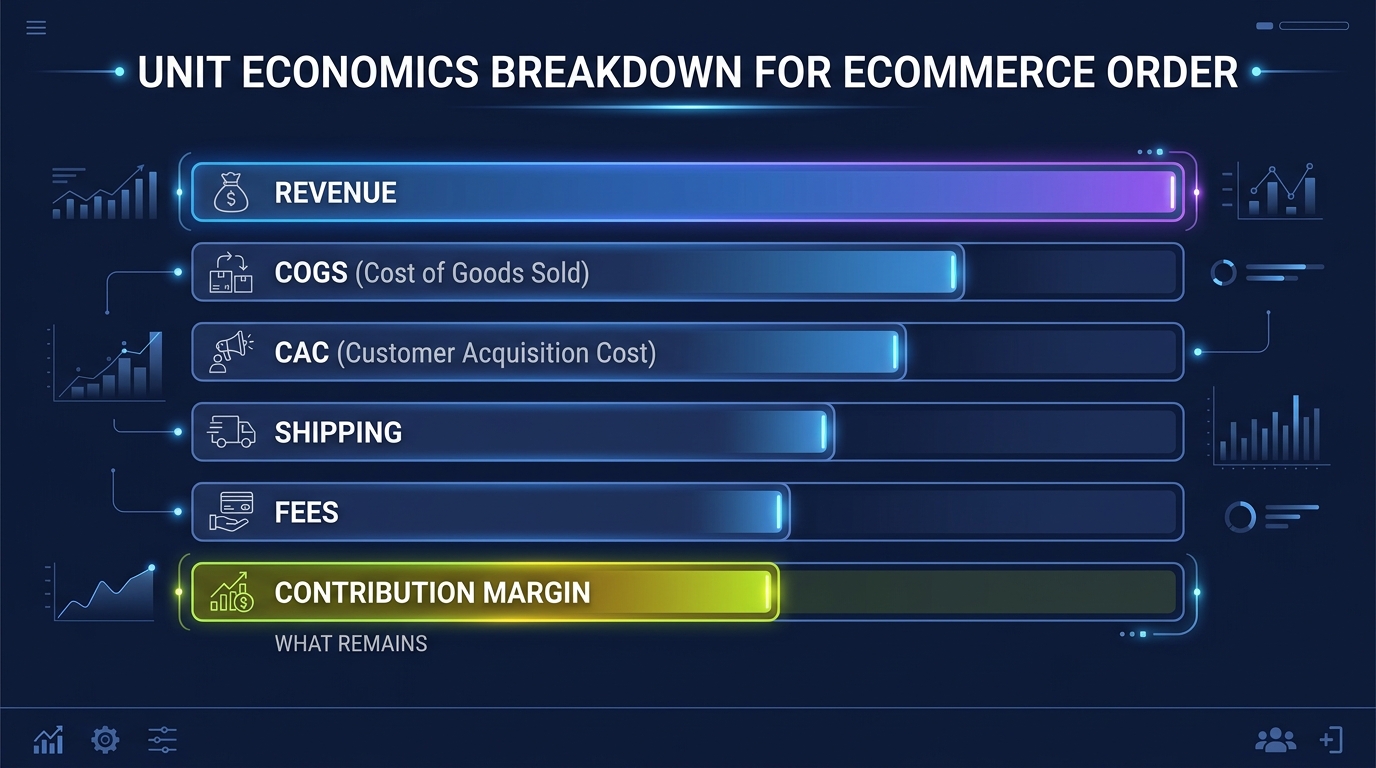
But revenue is not profit. Revenue is the starting point -- the top of a pipe with 6 holes in it (COGS, shipping, returns, payment fees, platform costs, and the ad spend itself).
ROAS does not account for:
- Your cost of goods (the biggest expense for most stores)
- Payment processing fees (2.9% + $0.30 per transaction)
- Shipping costs (especially the gap between what you charge and what you pay)
- Return processing (which can be $35-55 per return)
- Platform and app fees
- Discounts and promotions used to close the sale
A product with 80% gross margin and 3x ROAS might be very profitable. A product with 30% gross margin and 5x ROAS might be losing money. The ROAS number by itself tells you nothing about whether the sale was worth making.
The ROAS Trap: Real Numbers
Let me demonstrate with two real scenarios:
Scenario A: "Low" ROAS, High Profit
Product: Premium Yoga Mat, $89
- COGS: $22 (25% of price)
- Ad spend per sale: $29.67 (3x ROAS)
- Shipping gap: $2.50
- Payment fee: $2.88
- Return cost reserve (5% rate): $2.25
- Profit per sale: $29.70 (33% margin)
Scenario B: "High" ROAS, No Profit
Product: Phone Case, $19.99
- COGS: $8 (40% of price)
- Ad spend per sale: $4 (5x ROAS)
- Shipping gap: $3.50 (flat rate)
- Payment fee: $0.88
- Return cost reserve (12% rate): $4.80
- Profit per sale: -$1.19 (LOSING money)
The phone case has 5x ROAS -- almost double the yoga mat. But it loses money on every sale. Because the product margin is too thin to absorb the non-ad costs.
This is why the deep research on ecommerce competitors consistently finds that "data inaccuracy" and "misleading profit reporting" are the top complaints. BeProfit has been specifically called out for "chỉ tính ad spend attributed" -- only counting attributed ad spend, which artificially inflates reported ROAS and makes stores think they are more profitable than they actually are.
The 3 Numbers to Track Instead of ROAS
Number 1: Contribution Margin After Ads (CMA)
This is the number that tells you if your advertising is actually profitable:
CMA = Revenue - COGS - Shipping - Payment Fees - Return Reserve - Ad Spend
If CMA is positive, the ad campaign created real profit. If CMA is negative, you are paying people to buy from you regardless of what ROAS says.
Track CMA per campaign AND per SKU. A campaign might have positive CMA overall, but individual SKUs within it might be hemorrhaging money.
Number 2: Profit Per Ad Dollar (PPAD)
This is ROAS for grown-ups:
PPAD = Contribution Margin After Ads / Ad Spend
If PPAD is 0.5, every dollar you spend on ads generates $0.50 in actual profit (after all costs). That is a useful number. A PPAD of 0 means break-even. Below 0 means you are losing money.
Compare PPAD across campaigns, channels, and SKUs. The campaign with 3x ROAS and high margins will beat the 5x ROAS campaign with thin margins every time.
Number 3: Blended CAC-to-LTV Ratio
Over time, a customer might buy more than once. The math changes when you account for repeat purchases:
CAC:LTV Ratio = Customer Lifetime Value / Customer Acquisition Cost
- Below 1:1 -- You are losing money on that customer. Period.
- 1:1 to 2:1 -- Break-even to thin margin. Risky.
- 3:1 or above -- Healthy. You can afford to acquire.
For one-time purchase products, your CAC must be recovered on the FIRST order. There is no "lifetime value" to bail you out.
The "Profitable ROAS" Threshold (Per SKU)
You can calculate the minimum ROAS needed for each product to actually make money. Here is the formula:
Minimum Profitable ROAS = 1 / (1 - COGS% - Shipping% - Fee% - Return% - Target Margin%)
Example for a product at $50:
- COGS: 40% ($20)
- Shipping gap: 5% ($2.50)
- Fees: 3.5% ($1.75)
- Return reserve: 4% ($2)
- Target margin: 15% ($7.50)
Remaining for ad spend: 32.5% ($16.25)
Minimum profitable ROAS = $50 / $16.25 = 3.08x
Anything below 3.08x ROAS on this product and you are losing money -- even if your ad manager says "3x is solid."
For a product with 60% COGS (cheaper product, thin margins), minimum profitable ROAS jumps to 5x or higher. This is why cheap products are so hard to advertise profitably.
What Smart Founders Do Differently
1. They Set ROAS Floors Per SKU, Not Per Campaign
A blanket "4x ROAS target" is meaningless when your catalog has products ranging from 30% margin to 70% margin. High-margin products might be profitable at 2x ROAS. Low-margin products might need 6x.
Calculate minimum profitable ROAS per product. Then set campaign-level targets based on the product mix.
2. They Track Profit Per Channel, Not ROAS Per Channel
Upload your data to Okiela. The profit engine shows you actual contribution margin by sales channel -- so you can see which channels generate real profit, not just revenue.
You might discover that your "low ROAS" Google Shopping campaign is more profitable than your "high ROAS" Meta retargeting because the Google customers buy higher-margin products.
3. They Invest in Zero-CAC Revenue First
The most profitable revenue is from customers you already have. Email, SMS, and loyalty programs have near-zero acquisition cost.
Before increasing ad spend, ask: "Have I maximized my existing customer revenue?" If your email program is generating $8K/month in profit with no ad spend, doubling down there might be smarter than chasing another point of ROAS.
4. They Kill Unprofitable SKUs Fast
When a product cannot sustain advertising at any reasonable ROAS level, the answer is not "optimize the ad creative." The answer is to stop advertising that product (or raise its price until the math works).
The AI in Okiela flags SKUs where CMA is negative and recommends either a specific price increase or reallocating ad spend to higher-margin products. It takes the emotion out of the decision.
What to Do This Week
- 1List your top 10 SKUs by ad spend. Which ones get the most advertising dollars?
- 1Calculate minimum profitable ROAS for each. Use the formula above. You might find that 3-4 of your top 10 SKUs need higher ROAS than they are currently getting.
- 1Upload to Okiela. See contribution margin after ads per SKU. The AI identifies exactly which campaigns and products are profitable and which are burning cash.
- 1Set SKU-level ROAS floors. Give your ad manager (or yourself) clear thresholds: "Product A needs 3x minimum. Product B needs 5x minimum. Product C: do not advertise, it is profitable only through organic."
- 1Shift 20% of ad budget to retention. Take the lowest-performing 20% of your ad spend and redirect it to email, SMS, or loyalty. Track the profit difference after 30 days.
The Bottom Line
ROAS is a vanity metric wearing a suit. It looks professional. It sounds authoritative. And it tells you almost nothing about whether you are making money.
The founders who are actually profitable in 2026 track contribution margin after ads, profit per ad dollar, and CAC:LTV ratio. They set different ROAS thresholds per product. And they never confuse revenue with profit.
Your ad dashboard might say you are winning. Your bank account knows the truth.
Free analysis on Okiela. Upload your data, see your real profit per channel and per SKU in 30 seconds. 3 analyses/month, no credit card.
Find the hidden profit leaks draining your store.
Send one order export. Get your 3 biggest profit leaks back within 48 hours.
Request a free Profit Leakage AuditFree, founder-run, no pitch unless you ask. Every number labeled Verified or Estimated. Remove customer PII before upload.
Enjoyed this article?
Get weekly profit optimization tips and Okiela product news delivered to your inbox.
No spam. Unsubscribe anytime.
Nguyen Tuan Dai
Founder & CEO, Okiela
FP&A analyst building ecommerce tools on the side. Helping founders see their real numbers since 2025.