CAC vs LTV for Ecommerce: The Two Numbers That Decide If You Survive
Customer Acquisition Cost went up 233% in 10 years. If you do not know your CAC and LTV, you are making growth decisions blind. Here is how to calculate both — simply.
Nguyen Tuan Dai
Founder & CEO, Okiela
Key Takeaways
- 1CAC rose 233% in 10 years (from $24-28 to $78-82) -- know your number or fly blind
- 2LTV:CAC ratio sweet spot is 3:1 to 5:1 -- below 3:1 means thin margins that cannot absorb a bad month
- 3CAC Payback Period matters as much as the ratio -- 16-month payback kills cash flow even with good LTV
- 4A home goods brand improved from 0.8:1 to 1.76:1 in 90 days by cutting one channel and adding email flows
- 5Use Profit LTV (not Revenue LTV) in your ratio -- the margin makes all the difference
Table of Contents (8 sections)
I had a call last month with a founder who was spending $12,000 a month on ads. Growing fast. New customers every day.
"How much does it cost you to get a new customer?" I asked.
Silence.
"What is your average customer worth over their lifetime?"
More silence.
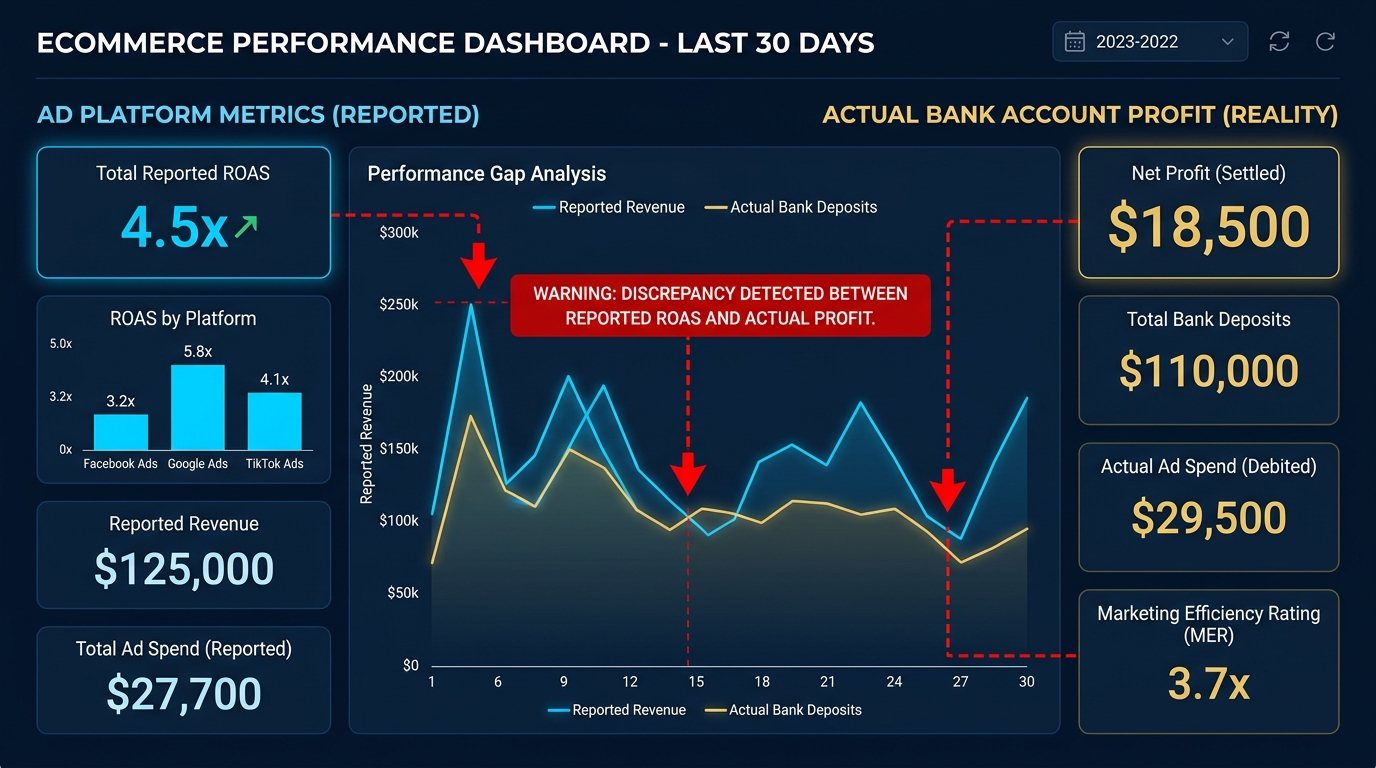
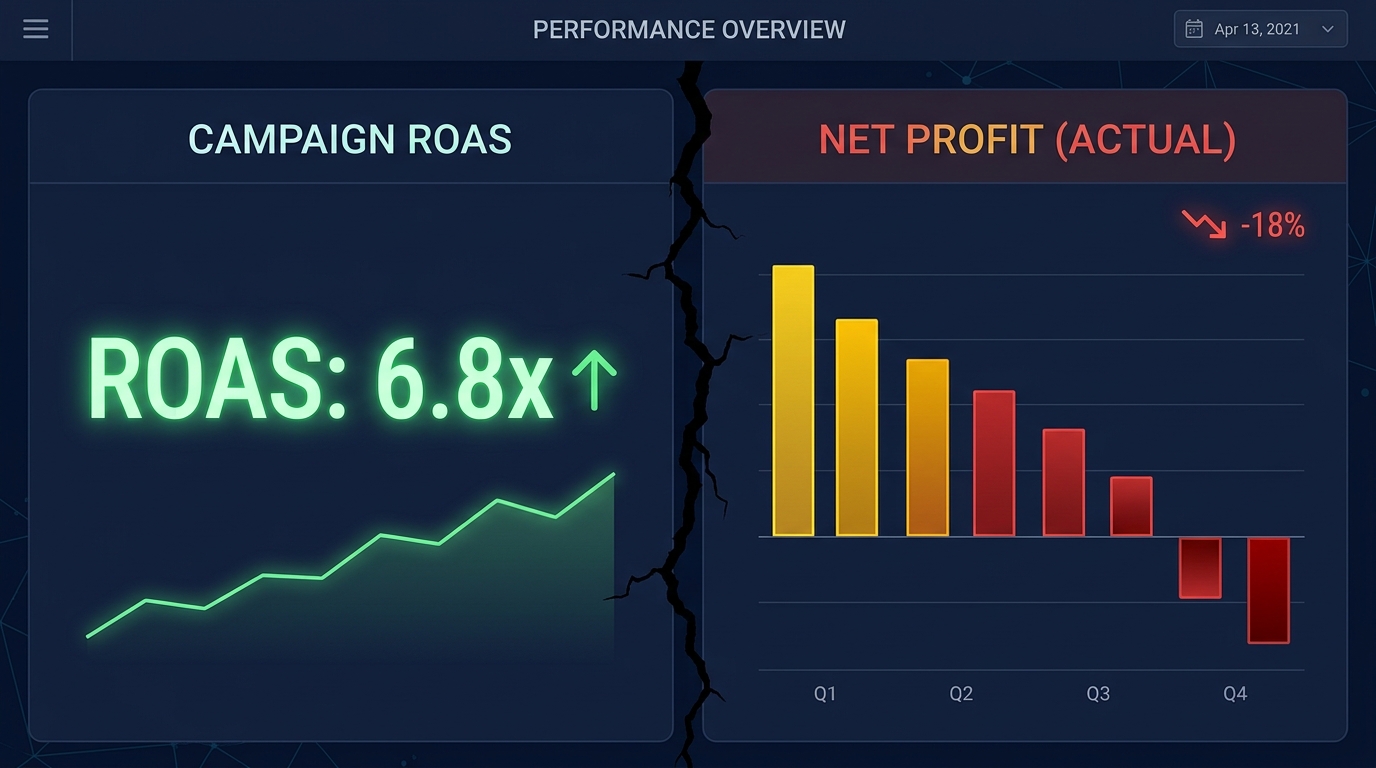
He was spending $12,000 a month without knowing if he was buying customers at a profit or a loss. And honestly? He is not unusual. Most ecommerce founders I talk to cannot answer these two questions.
But these two numbers — CAC and LTV — are literally the math that decides whether your business lives or dies.
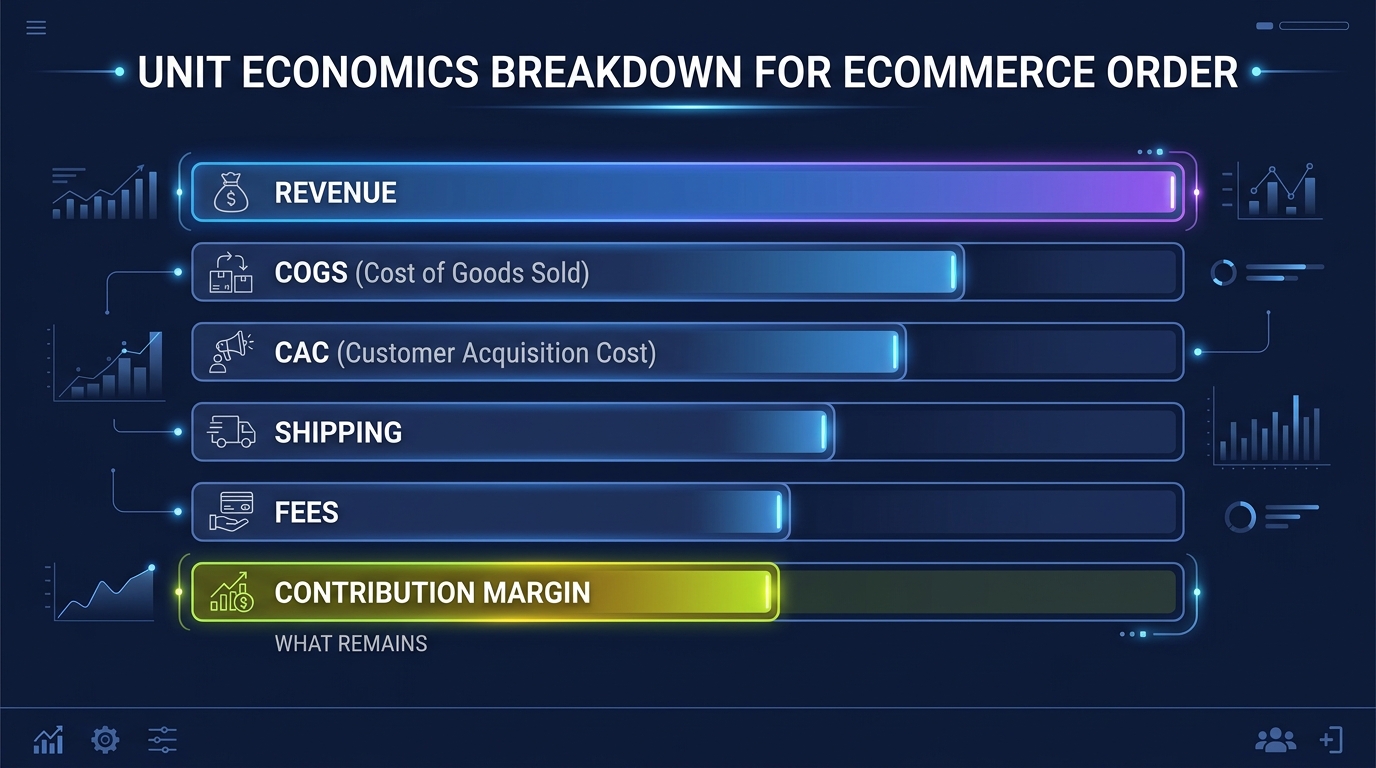
CAC: What It Costs to Buy a Customer
Customer Acquisition Cost is simple in concept:
CAC = Total Marketing Spend / Number of New Customers
If you spent $10,000 on marketing last month and got 125 new customers, your CAC is $80.
But here is where it gets tricky. What counts as "marketing spend"?
Most founders only count ad spend. That is incomplete. Your real marketing spend includes:
- Ad spend (Meta, Google, TikTok, Pinterest)
- Agency fees (if applicable)
- Influencer costs
- Email platform costs (Klaviyo, etc.)
- Content creation costs
- Discounts used specifically for acquisition (first-order 15% off)
That last one catches people off guard. If you offer 15% off for first-time buyers and your average order is $80, you are giving away $12 per new customer. That is part of your CAC.
True CAC formula:
Total Ad Spend + Agency Fees + Influencer Costs + Email Platform + Content Costs + Acquisition Discounts = Total Acquisition Cost
Divide by new customers. That is your real CAC.
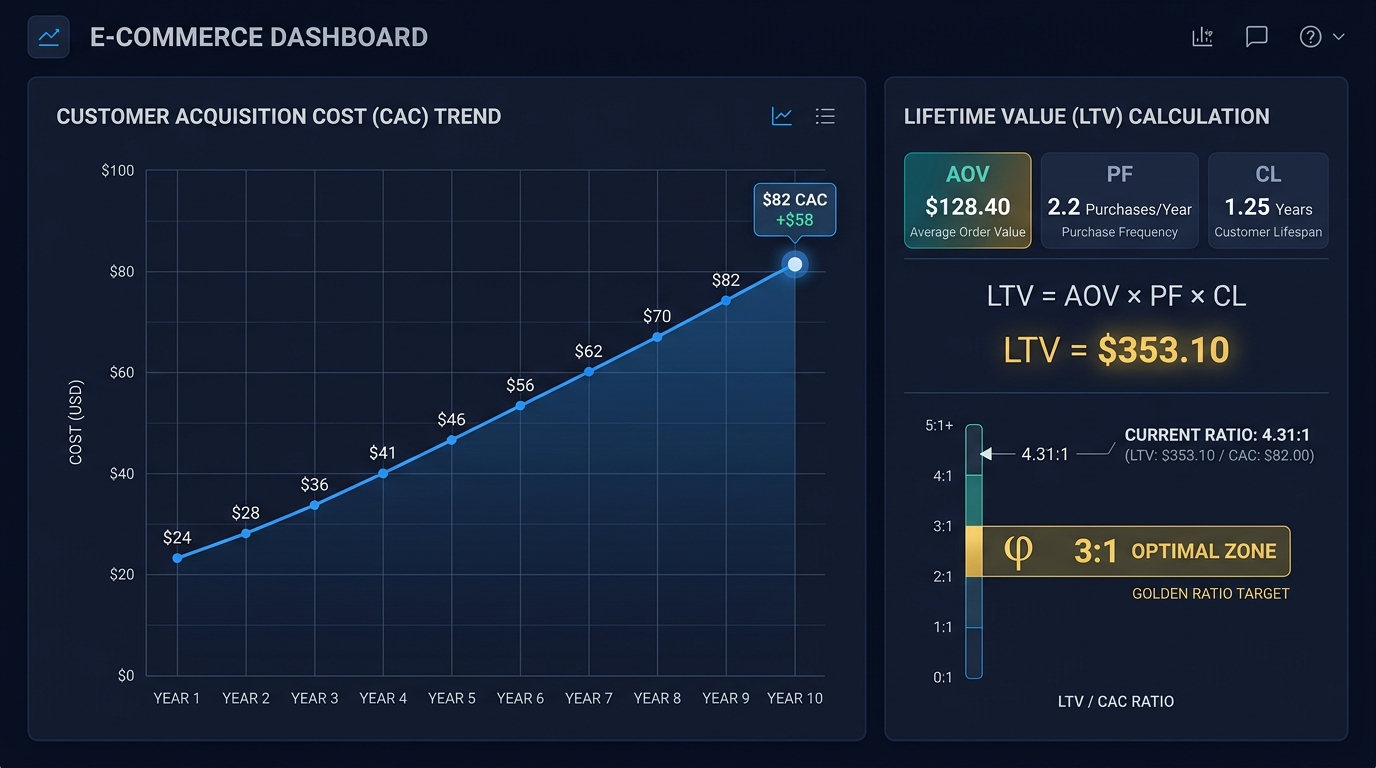
For context: the average ecommerce CAC in 2015 was around $24-28. By 2025, it reached $78-82. That is a 233% increase in 10 years. And it is still climbing in 2026.
LTV: What a Customer Is Actually Worth
Lifetime Value is how much revenue (or better — profit) one customer generates over their entire relationship with your brand.
Simple LTV = Average Order Value × Average Purchase Frequency × Average Customer Lifespan
Example:
- Average order: $75
- Purchases per year: 2.3
- Customer lifespan: 2.5 years
- LTV = $75 × 2.3 × 2.5 = $431
That is the revenue LTV. But what really matters is the profit LTV:
Profit LTV = Revenue LTV × Average Margin
If your average margin after COGS and variable costs is 35%:
Profit LTV = $431 × 0.35 = $151
This is the number that matters. Each customer, on average, generates $151 in actual profit over their lifetime. That is the budget you have to acquire them.
The Ratio That Rules Everything: LTV:CAC
Now put them together:
LTV:CAC Ratio = Profit LTV / CAC
If your Profit LTV is $151 and your CAC is $80:
LTV:CAC = $151 / $80 = 1.9:1
What does that mean?
| Ratio | What It Means |
|---|---|
| Below 1:1 | You lose money on every customer. Stop spending now. |
| 1:1 to 2:1 | Barely breaking even. Very risky. One bad month and you are underwater. |
| 2:1 to 3:1 | Healthy but tight. Focus on increasing LTV or reducing CAC. |
| 3:1 to 5:1 | Strong unit economics. Safe to scale. |
| Above 5:1 | You might be underinvesting in growth. Could afford to spend more. |
The sweet spot is 3:1 to 5:1. Below 3:1 means your margins are too thin to absorb a bad month. Above 5:1 means you are leaving growth on the table.
CAC Payback Period: The Cash Flow Killer Nobody Talks About
There is a third number that is just as important as CAC and LTV, but almost nobody tracks it.
CAC Payback Period = CAC / (Average Monthly Revenue per Customer × Margin %)
This tells you how many months it takes to earn back what you spent to acquire a customer.
Example:
- CAC: $80
- Average monthly revenue per customer: $14.38 ($431 LTV ÷ 30 months)
- Margin: 35%
- Monthly profit per customer: $5.03
Payback period: $80 / $5.03 = 15.9 months
That means you spend $80 today to acquire a customer, and it takes almost 16 months to get that $80 back in profit.
Think about what that means for cash flow. If you acquire 100 customers this month ($8,000 in CAC), you will not see that money back for over a year. Meanwhile, you still need to pay for inventory, shipping, your Shopify plan, and next month's ads.
This is why profitable-on-paper businesses go broke. The P&L shows profit. But the cash is tied up in customer acquisition that has not paid back yet.
Healthy payback periods:
- Under 6 months: Excellent. Scale aggressively.
- 6-12 months: Good. Safe to grow, but watch cash flow.
- 12-18 months: Tight. Need strong repeat purchase rates or financing.
- Over 18 months: Dangerous. Fix your unit economics before spending more.
How to Fix Bad Unit Economics
If your LTV:CAC ratio is below 3:1, you have two levers:
Lever 1: Reduce CAC
- Cut unprofitable channels. If TikTok has a $120 CAC and Meta has a $65 CAC, shift budget.
- Improve conversion rate. A landing page that converts at 3% instead of 2% cuts your CAC by 33%.
- Build organic channels. SEO, email, content, referrals. These have near-zero marginal CAC.
- Fix your first-purchase offer. A 10% discount converts nearly as well as 20% but cuts acquisition cost in half.
Lever 2: Increase LTV
- Improve repeat purchase rate. Post-purchase email flows, loyalty programs, subscription options.
- Increase AOV. Bundles, upsells, cross-sells. A $10 AOV increase on a 2.3 purchases/year customer adds $23 to annual value.
- Reduce churn. Figure out why customers do not come back. Product quality? Shipping experience? Boring email follow-up?
- Launch higher-margin products. If your current catalog has 30% margin, a new product line at 50% margin lifts your whole LTV.
Real Example: Fixing a 1.4:1 Ratio
A home goods brand I analyzed had these numbers:
- CAC: $92
- Revenue LTV: $268
- Margin: 28%
- Profit LTV: $75
- LTV:CAC = 0.8:1 — losing money on every customer
Here is what they changed over 90 days:
- 1Cut TikTok spend ($3,000/month saved, those customers had lowest LTV)
- 2Added post-purchase email flow (increased repeat rate from 1.5 to 2.1 purchases)
- 3Launched a bundle (raised AOV from $56 to $72)
- 4Negotiated shipping rates (margin improved from 28% to 33%)
After 90 days:
- CAC dropped to $71 (cut inefficient channel)
- Revenue LTV increased to $378 (better repeat rate + higher AOV)
- Margin improved to 33%
- Profit LTV: $125
- New LTV:CAC = 1.76:1 — still below 3:1, but heading the right direction
Not a miracle transformation. Just basic math applied consistently.
How to Calculate Yours in 30 Minutes
Step 1: Find Your CAC (10 minutes)
Add up everything you spent on marketing last month. Every ad dollar, every agency fee, every influencer payment, every acquisition discount. Divide by new customers.
If you cannot separate new customers from returning, use this shortcut: new customers ≈ total customers - (total customers × repeat purchase rate). For most Shopify stores, 60-75% of monthly orders come from first-time buyers.
Step 2: Find Your LTV (15 minutes)
Pull your average order value from Shopify Analytics. Estimate purchase frequency (total orders in 12 months ÷ unique customers). Estimate customer lifespan (most DTC brands: 1.5-3 years). Multiply.
Then multiply by your margin. If you do not know your margin, read the P&L article on this blog and calculate it. Or upload your data to Okiela — it calculates margin automatically.
Step 3: Find Your Ratio and Payback (5 minutes)
Divide Profit LTV by CAC. Check it against the table above. Calculate payback period. If payback is over 12 months, you need to either reduce CAC or increase LTV before scaling.
This week: Run these three calculations. Write the numbers down. Tape them to your monitor. Check them every month. That is it. No fancy tools required for the basic math.
What Okiela Adds to This
Okiela calculates your contribution margin per order and per SKU automatically from your Shopify data. That gives you the precise margin number you need for accurate LTV and CAC calculations — instead of guessing.
The profit dashboard breaks down exactly where costs eat into your margin (COGS, shipping, fees, returns), so you can see which lever to pull first to improve your ratio.
Upload your CSV, get your real margins, then plug those into the CAC and LTV formulas above. The difference between guessing your margin is 35% and knowing it is 28% changes your entire growth strategy.
Free plan on Okiela gives you 3 analyses per month. Enough to get your real numbers and make decisions based on math, not hope.
Find the hidden profit leaks draining your store.
Send one order export. Get your 3 biggest profit leaks back within 48 hours.
Request a free Profit Leakage AuditFree, founder-run, no pitch unless you ask. Every number labeled Verified or Estimated. Remove customer PII before upload.
Enjoyed this article?
Get weekly profit optimization tips and Okiela product news delivered to your inbox.
No spam. Unsubscribe anytime.
Nguyen Tuan Dai
Founder & CEO, Okiela
FP&A analyst building ecommerce tools on the side. Helping founders see their real numbers since 2025.