The Simple Profit Waterfall Every Shopify Founder Should Use (5 Levels)
A profit waterfall shows exactly where your revenue disappears on its way to your bank account. Here are the 5 levels, with real numbers from a Shopify store.
Nguyen Tuan Dai
Founder & CEO, Okiela
Key Takeaways
- 15 levels: GMV > Net Revenue > Gross Profit > Net Profit > True Profit
- 2An $85K/month store kept only $11.5K (13.5%) after all costs through the waterfall
- 3The biggest gap between levels tells you exactly where to focus optimization
- 4Waterfalls beat dashboards because they show the STORY of your money, not just snapshot numbers
- 5Every number in the waterfall should be auditable -- Okiela shows source data and calculation rules for each level
Table of Contents (8 sections)
If someone asked you right now "where does your money go between a sale and your bank account?" -- could you answer with exact numbers?
Most founders cannot. They know revenue. They vaguely know COGS. Everything in between is a blur.
A profit waterfall fixes that. It is a visual framework that shows exactly how much money you lose at each step between "customer pays" and "you keep what is left."
I use a 5-level waterfall for every store I analyze. Once you see your numbers laid out this way, you will never look at a revenue chart the same way again.
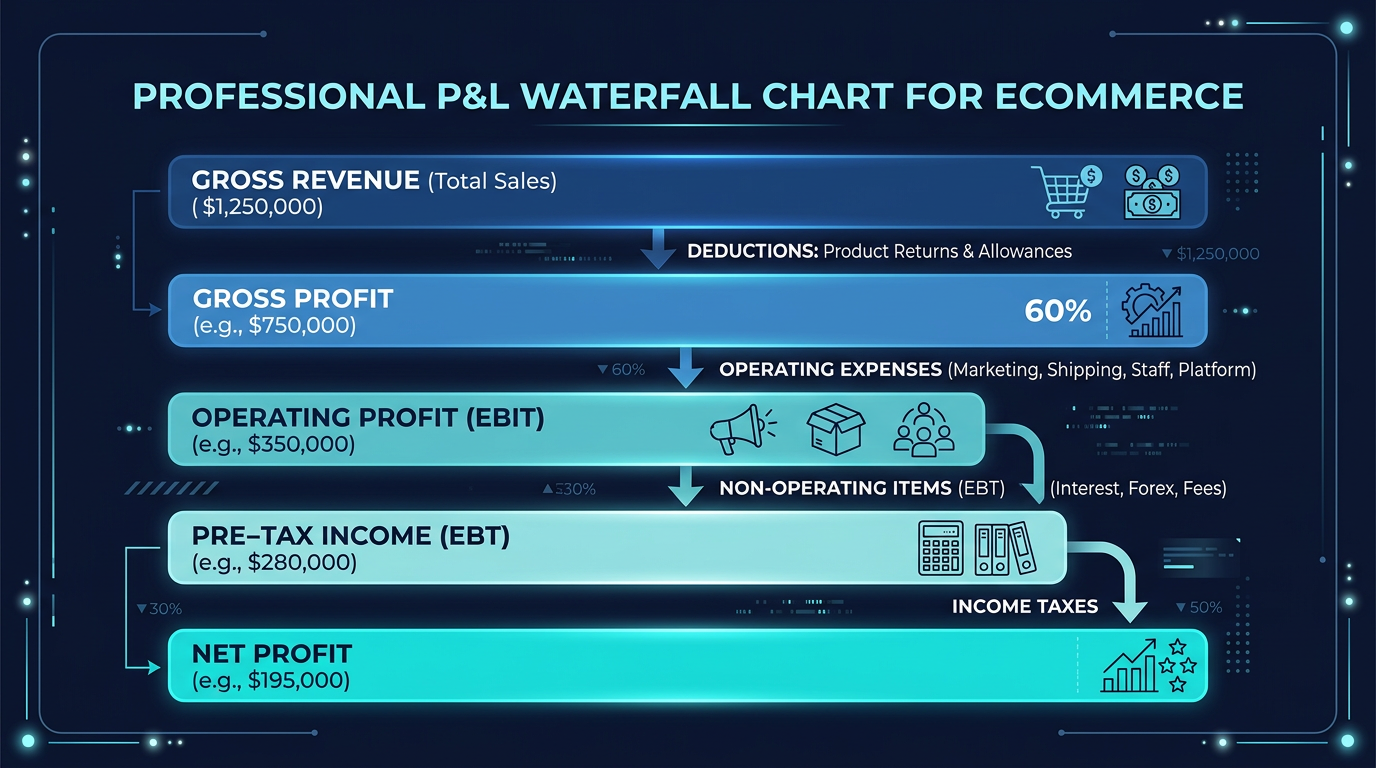
What Is a Profit Waterfall?
Think of revenue as water flowing down a series of steps. At each step, some water leaks out (costs). What reaches the bottom is your actual profit.
A waterfall chart makes this visible. You start with the big number at the top (gross revenue) and watch it shrink through 5 levels as costs are subtracted. Each level answers a specific question about your business.
The 5 Levels
Level 1: GMV (Gross Merchandise Value)
What it is: Total dollar value of all sales before any deductions.
What it tells you: How much demand your store generates.
This is the number Shopify shows on your home screen. The number you screenshot. The number that means almost nothing by itself.
Example: $85,000 GMV
Level 2: Net Revenue
What it is: GMV minus returns, refunds, and discounts.
What it tells you: How much money you actually collected from customers.
This is the first reality check. That $85K in sales? Some of it came back as refunds. Some of it was given away as discounts. Net Revenue is the actual cash that entered your ecosystem.
- GMV: $85,000
- Returns and refunds: -$6,800 (8%)
- Discount codes: -$5,100 (6%)
- Net Revenue: $73,100
You thought you made $85K. You actually collected $73K. That is a $12K gap at the very first step.
Level 3: Gross Profit
What it is: Net Revenue minus Cost of Goods Sold (COGS).
What it tells you: Whether your product pricing is fundamentally viable.
COGS includes everything it costs to get the product into shippable condition: manufacturer price, inbound freight, duties and tariffs, packaging, and quality control.
- Net Revenue: $73,100
- COGS (landed): -$29,240 (40% of net revenue)
- Gross Profit: $43,860 (60% gross margin)
Healthy gross margin for DTC: 55-70%. Below 50% means your products might be priced too low or your supply chain costs too high. Fix this BEFORE worrying about anything else downstream.
Level 4: Net Profit (After Variable Costs)
What it is: Gross Profit minus all variable costs that scale with each order.
What it tells you: Whether your business model works at scale.
This is where most of the hidden money leaks happen:
- Gross Profit: $43,860
- Shipping costs (net of customer payments): -$5,840
- Payment processing fees: -$2,480
- Return processing costs: -$2,720
- Estimated platform fees (per-order allocation): -$1,460
- Net Profit: $31,360 (42.9% of net revenue)
Four cost categories that Shopify does not track for you. Together, they took $12,500 out of your gross profit.
Level 5: True Profit (After Everything)
What it is: Net Profit minus ad spend, fixed costs, and team costs.
What it tells you: What is actually left for YOU.
- Net Profit: $31,360
- Ad spend: -$14,600
- Shopify plan + app subscriptions: -$750
- Team/freelancer costs: -$4,000
- Other fixed costs: -$500
- True Profit: $11,510 (15.8% of net revenue)
That is the complete picture. From $85K in headline sales to $11.5K in your pocket. A 13.5% true profit margin relative to GMV.
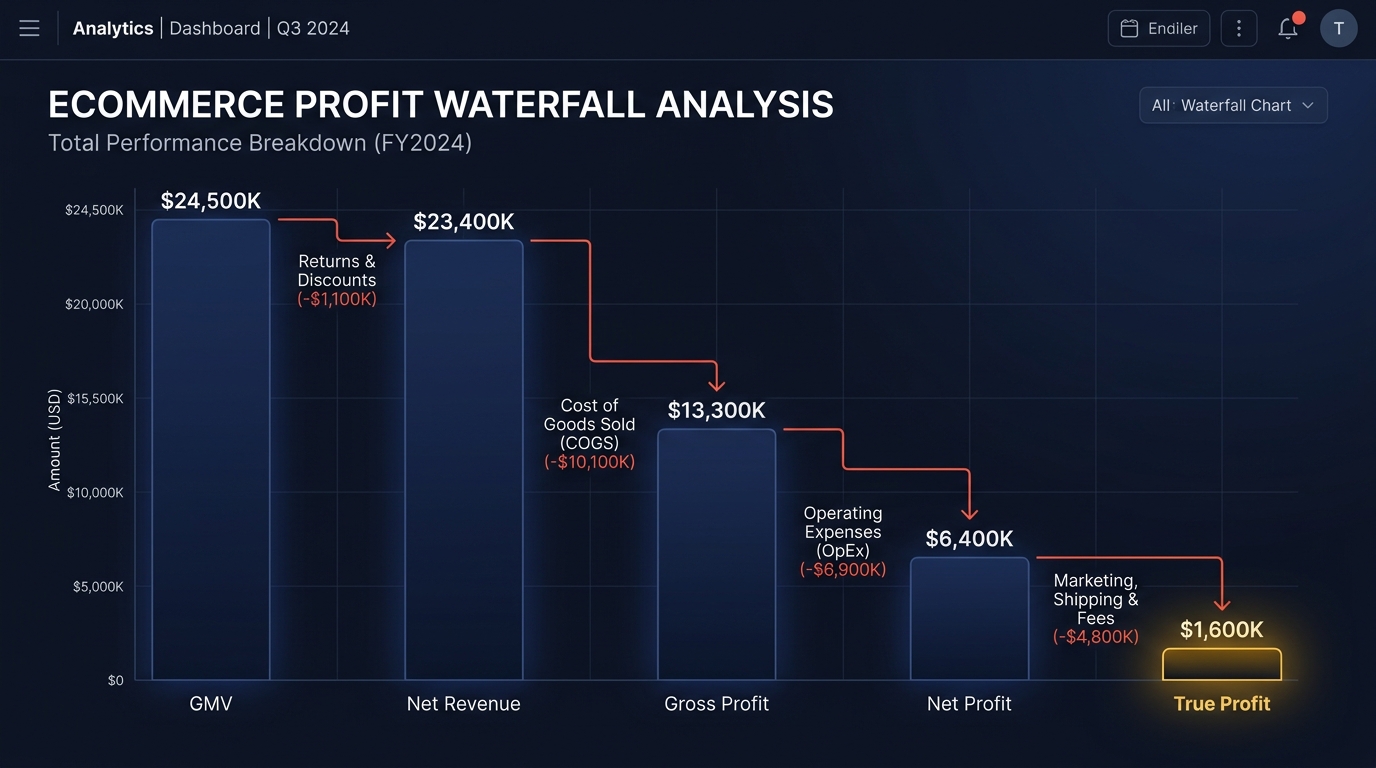
The Complete Waterfall (One Table)
| Level | Amount | % of GMV | % of Net Rev |
|---|---|---|---|
| L1: GMV | $85,000 | 100% | -- |
| Returns + Discounts | -$11,900 | -14.0% | -- |
| L2: Net Revenue | $73,100 | 86.0% | 100% |
| COGS (landed) | -$29,240 | -34.4% | -40.0% |
| L3: Gross Profit | $43,860 | 51.6% | 60.0% |
| Shipping (net) | -$5,840 | -6.9% | -8.0% |
| Payment fees | -$2,480 | -2.9% | -3.4% |
| Return processing | -$2,720 | -3.2% | -3.7% |
| Platform fees | -$1,460 | -1.7% | -2.0% |
| L4: Net Profit | $31,360 | 36.9% | 42.9% |
| Ad spend | -$14,600 | -17.2% | -20.0% |
| Fixed costs (Shopify + apps) | -$750 | -0.9% | -1.0% |
| Team costs | -$4,000 | -4.7% | -5.5% |
| Other fixed | -$500 | -0.6% | -0.7% |
| L5: True Profit | $11,510 | 13.5% | 15.8% |
Every row is a specific, trackable cost. No mystery. No "miscellaneous." Just clear numbers showing where the money went.
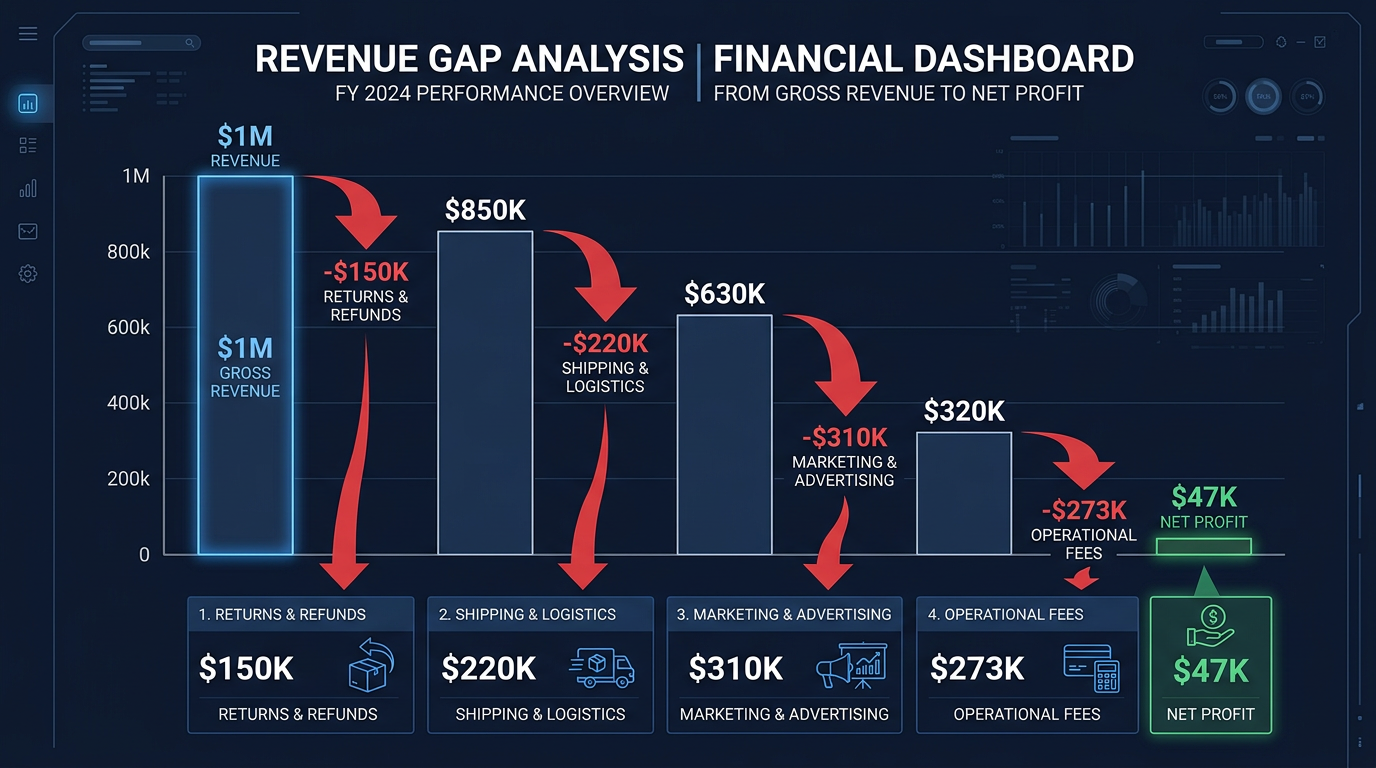
Why Waterfalls Beat Dashboards
Most analytics tools show you a grid of KPI cards: revenue, orders, AOV, maybe gross margin. They look nice. But they do not tell you the STORY of your money.
A waterfall tells the story. You literally watch your revenue shrink through each cost layer. The biggest bars are where the most money leaks. That visual instantly tells you where to focus.
If the gap between L3 and L4 is massive, your variable costs (shipping, fees, returns) are the problem. If the gap between L4 and L5 is massive, your ad spend is too high relative to the margin available.
No other visualization does this as clearly.
How to Read Your Waterfall for Action
If L1 to L2 is a big drop (>15%)
Your return rate or discount strategy is aggressive. Options:
- Tighten discount policy (fewer codes, lower percentages)
- Reduce returns through better product descriptions and sizing guides
- Switch to exchange-first return policy
If L2 to L3 is a big drop (COGS >45% of Net Rev)
Your products are priced too low or your supply chain is too expensive. Options:
- Raise prices on high-demand SKUs
- Negotiate supplier contracts
- Find alternative manufacturers
If L3 to L4 is a big drop (variable costs >15% of Net Rev)
Your per-order costs are eating your gross margin. The usual culprits:
- Shipping gap (you are absorbing too much shipping cost)
- High return processing costs on certain SKUs
- Payment fees on low-price items (the $0.30 flat fee hurts more on cheap products)
If L4 to L5 is a big drop (ad spend + fixed costs >25%)
Your customer acquisition is too expensive or your overhead is too high. Options:
- Shift to lower-CAC channels (email, SEO, referral)
- Kill unprofitable ad campaigns
- Audit your app stack (the $400/month in apps you forgot about)
How Okiela Builds This Automatically
You do not have to calculate any of this manually. Upload your Shopify CSV export to Okiela and the 5D profit pipeline generates a complete waterfall in 30 seconds.
The waterfall Okiela generates is interactive:
- Click any bar to see the detailed breakdown
- Hover for exact dollar amounts and percentages
- Audit notes explain where each number comes from
- The AI highlights which level has the biggest optimization opportunity
Every number is traceable. You can see the source data, the calculation rule, and the confidence level. This is what "Trust as a Feature" means -- you can verify every number, not just trust a black box.
No other profit analytics tool provides this level of transparency. Competitors show you a number. Okiela shows you the math behind the number.
Build Your First Waterfall This Week
Here is the fastest path:
- 1Export your Shopify data (Settings > Analytics > Reports > Export as CSV)
- 2Upload to Okiela (drag and drop, 10 seconds)
- 3See your waterfall (generated automatically in 30 seconds)
- 4Find the biggest leak (the widest gap between levels)
- 5Fix ONE thing (raise price, cut ad spend, negotiate shipping, reduce returns)
Then upload again next month and see if the leak got smaller.
The best founders I know review their waterfall monthly. Not because it is fun (it usually is not). Because every month the costs shift, and last month's optimized waterfall can become this month's leaky pipe.
The One Insight
Your revenue is not your money. It belongs to your suppliers, your carriers, your payment processor, your ad platforms, and your app vendors.
What is left after ALL of them take their cut? That is Level 5. That is your money.
See it clearly. Fix what is broken. Keep more of what you earn.
Free plan on Okiela includes 3 analyses per month. Upload your data and see your 5-level profit waterfall in 30 seconds. The truth about your money is always better than the guess.
Find the hidden profit leaks draining your store.
Send one order export. Get your 3 biggest profit leaks back within 48 hours.
Request a free Profit Leakage AuditFree, founder-run, no pitch unless you ask. Every number labeled Verified or Estimated. Remove customer PII before upload.
Enjoyed this article?
Get weekly profit optimization tips and Okiela product news delivered to your inbox.
No spam. Unsubscribe anytime.
Nguyen Tuan Dai
Founder & CEO, Okiela
FP&A analyst building ecommerce tools on the side. Helping founders see their real numbers since 2025.