Blended ROAS vs Channel ROAS: Which Number Should You Actually Trust?
Meta says 4x ROAS. Google says 5x. TikTok says 3x. Add them up and it is 3x your actual revenue. Here is how to read these numbers without losing your mind — or your money.
Nguyen Tuan Dai
Founder & CEO, Okiela
Key Takeaways
- 1Platform ROAS numbers overlap -- $91K attributed revenue from $58K actual revenue is common
- 2Blended ROAS = Total Revenue / Total Marketing Spend -- the honest, overlap-free number
- 3Cutting a "low ROAS" channel (TikTok) dropped total revenue because it was feeding the funnel
- 4Blended Profit ROAS is even more honest: profit (not revenue) divided by total marketing spend
- 5Test channel changes one at a time over 4 weeks -- it is the only reliable way to know what works
Table of Contents (8 sections)
Last Tuesday, a Shopify founder sent me a screenshot. Three ad dashboards side by side.
Meta Ads: $42,000 attributed revenue. Google Ads: $31,000 attributed revenue. TikTok: $18,000 attributed revenue.
Total attributed: $91,000.
His actual Shopify revenue for the month? $58,000.
"Where did the extra $33,000 come from?" he asked. "Or rather — where did it not come from?"
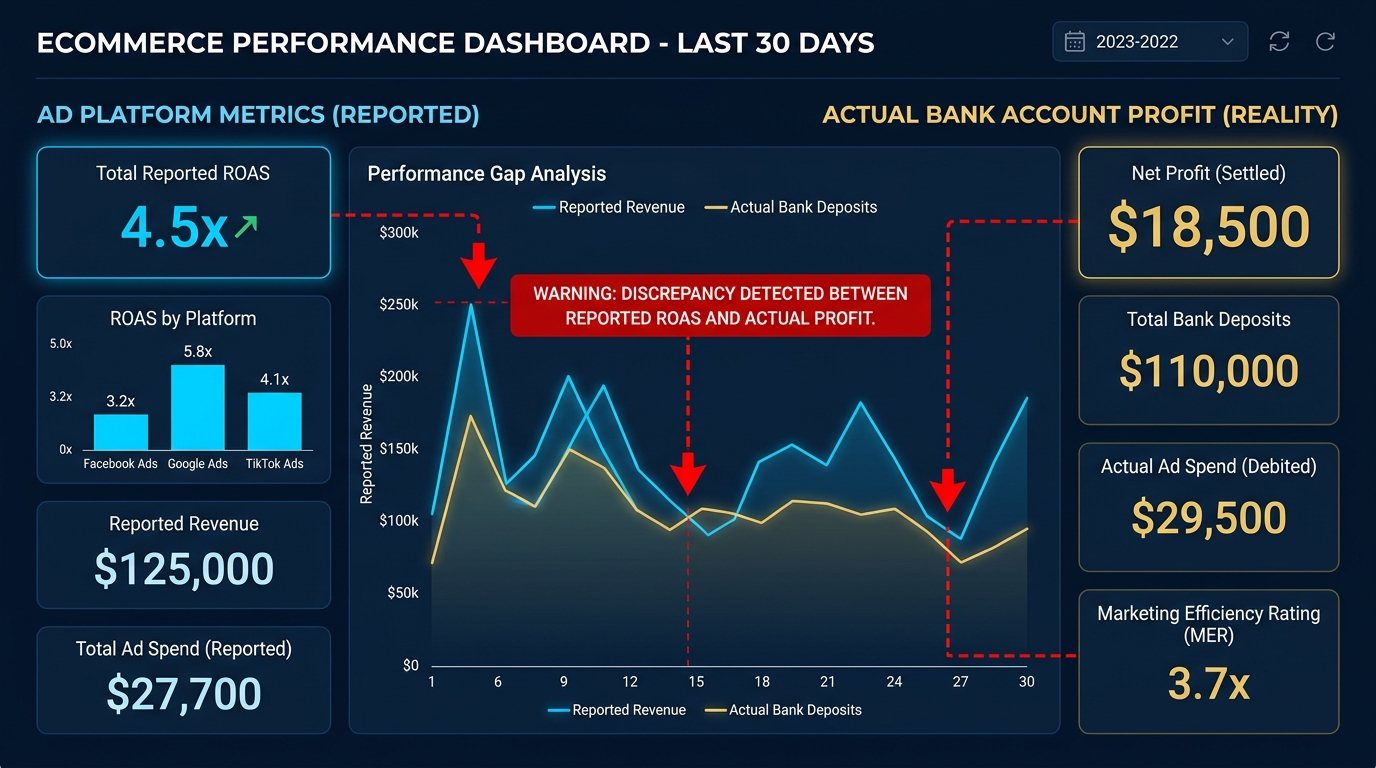
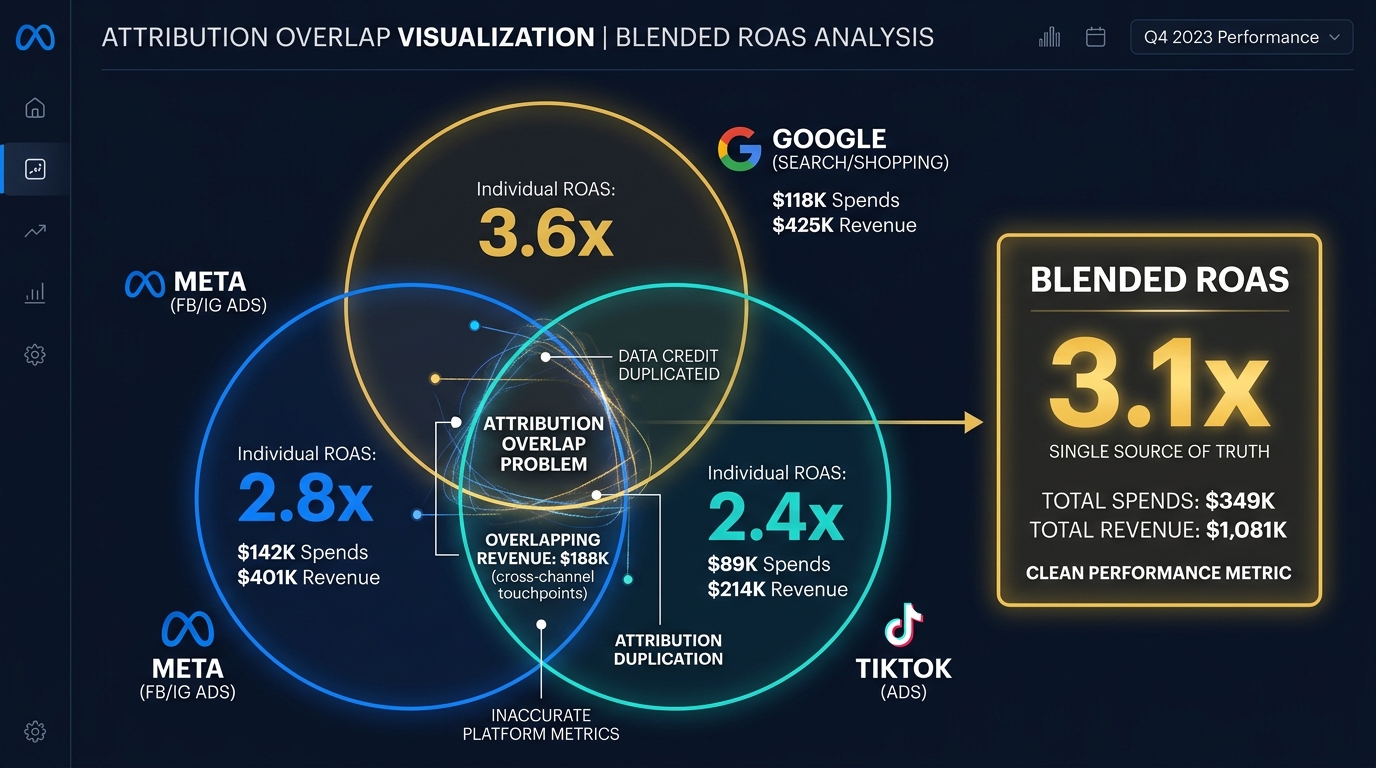
Welcome to the attribution overlap problem. Every ad platform takes credit for every conversion it touched, even when three platforms touched the same customer. The result: your "total" attributed revenue is always higher — sometimes much higher — than your real revenue.
This is not a bug. It is how these platforms are designed. And it is why you need to understand the difference between channel ROAS and blended ROAS.
Channel ROAS: What Each Platform Tells You
Channel ROAS is simple:
Channel ROAS = Revenue Attributed to Channel / Channel Ad Spend
Meta says you spent $8,000 and it generated $42,000 in revenue. That is 5.25x ROAS.
The problem? Meta counts a conversion if someone clicked your ad within 7 days OR viewed your ad within 1 day before purchasing. Google counts conversions with its own attribution window. TikTok has another.
So a customer who saw your TikTok ad, clicked your Meta ad, then Googled your brand name and bought through a Google Shopping ad — that single $75 order gets counted by all three platforms.
Three platforms. One order. Three claims of credit.
Multiply this across thousands of orders and you get the $91,000 vs $58,000 gap.
Blended ROAS (MER): The Honest Number
Blended ROAS — sometimes called Marketing Efficiency Ratio (MER) — ignores all attribution models. It is just simple math:
Blended ROAS = Total Revenue / Total Marketing Spend
Total Shopify revenue: $58,000
Total marketing spend (all channels): $14,500
Blended ROAS: 4.0x
No overlap. No attribution arguments. No platform bias.
This number tells you one thing: for every dollar you spend on marketing, your business generates $4 in revenue. It does not tell you WHICH channel did the work. But it tells you whether the total system is working.
When to Use Which
Here is the practical guide:
| Decision | Use This | Why |
|---|---|---|
| "Should I increase total marketing budget?" | Blended ROAS | Shows total business efficiency |
| "Which channel should get more budget?" | Channel ROAS + incrementality tests | Directional signal, verify with tests |
| "Is this specific campaign profitable?" | Campaign ROAS vs breakeven ROAS | But include ALL costs in breakeven calc |
| "Should I cut a channel entirely?" | Blended ROAS before/after test | Only real way to know true impact |
| "Am I getting more efficient over time?" | Blended ROAS trended monthly | The honest trendline |
The key insight: channel ROAS is directional. Blended ROAS is the truth.
You can use channel ROAS to compare campaigns within a platform (Campaign A vs Campaign B on Meta). But never add up channel ROAS numbers across platforms and expect them to equal reality.
Real Example: Where Budget Reallocation Went Wrong
A DTC brand selling fitness equipment was spending:
- Meta: $6,000/month (reported 4.8x ROAS)
- Google: $4,000/month (reported 6.2x ROAS)
- TikTok: $3,000/month (reported 2.1x ROAS)
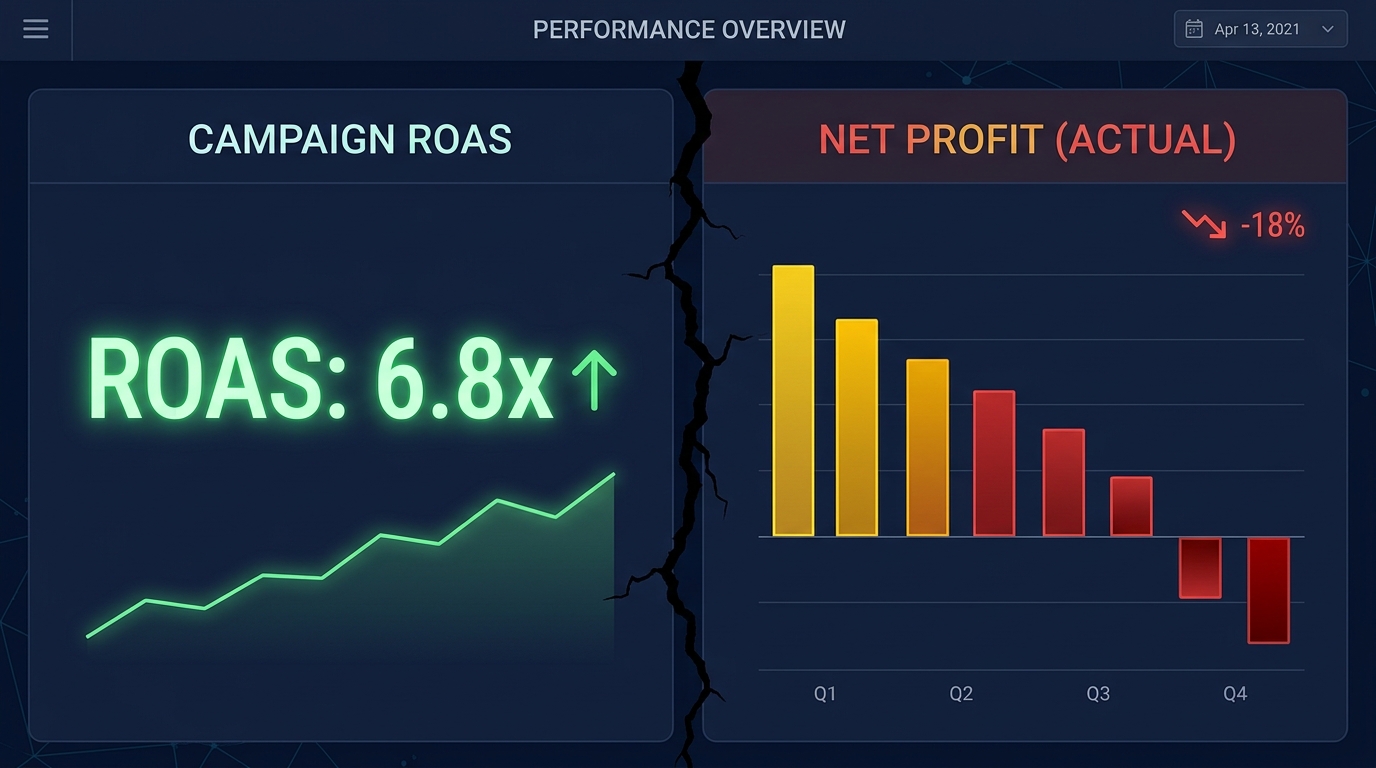
Looking at channel ROAS alone, the obvious move is: cut TikTok (lowest ROAS) and move that $3,000 to Google (highest ROAS).
They did exactly that.
Result after 30 days:
- Google spend: $7,000 (up from $4,000)
- Google revenue: not $7,000 × 6.2 = $43,400 as expected. Actual: $31,200 (4.46x, declining returns).
- Total revenue: dropped from $58,000 to $51,000
Why? TikTok was driving top-of-funnel awareness. People discovered the brand on TikTok, then searched on Google and bought there. When TikTok was cut, the Google "discovery" pipeline dried up.
The channel ROAS numbers made TikTok look worthless. But TikTok was feeding the funnel that made Google look great.
You cannot see this from channel ROAS alone. You can only see it by watching blended ROAS and testing changes one at a time.
The 4-Week Test Protocol
Here is how I recommend founders make budget decisions without getting fooled by attribution:
Week 1: Establish Baseline
Record blended ROAS for the last 4 weeks. Use total revenue ÷ total spend. This is your benchmark.
Week 2: Change ONE Variable
Pick the channel you want to test. Reduce or increase spend by 30%. Do not change anything else — no new products, no new landing pages, no big sales.
Week 3: Observe
Track daily revenue. Track blended ROAS. Track blended MER. If you cut a channel and total revenue drops by more than the spend you saved, that channel was net positive. If total revenue barely moves, the channel was not contributing much.
Week 4: Decide
Based on Week 3 data, make the permanent budget shift. Then repeat the test with the next channel.
This takes patience. But it is the only reliable way to know what is actually working.
How to Calculate Your Blended ROAS Right Now
Step 1: Open your Shopify admin. Go to Analytics > Overview. Note your total revenue for last month.
Step 2: Add up ALL marketing costs. Not just ad spend. Include:
- Meta Ads spend
- Google Ads spend
- TikTok Ads spend
- Pinterest / other platforms
- Agency management fees
- Influencer payments
- Email platform (Klaviyo, etc.) monthly cost
- Content creation costs
Step 3: Divide total revenue by total marketing spend.
That is your blended ROAS. Track it monthly. If it is going down, your marketing is getting less efficient — even if individual channel ROAS looks stable.
The Blended Profit ROAS (The Real Number)
Even blended ROAS has a limitation. It measures revenue, not profit.
A more honest metric:
Blended Profit ROAS = Total Profit / Total Marketing Spend
Using the example above:
- Total revenue: $58,000
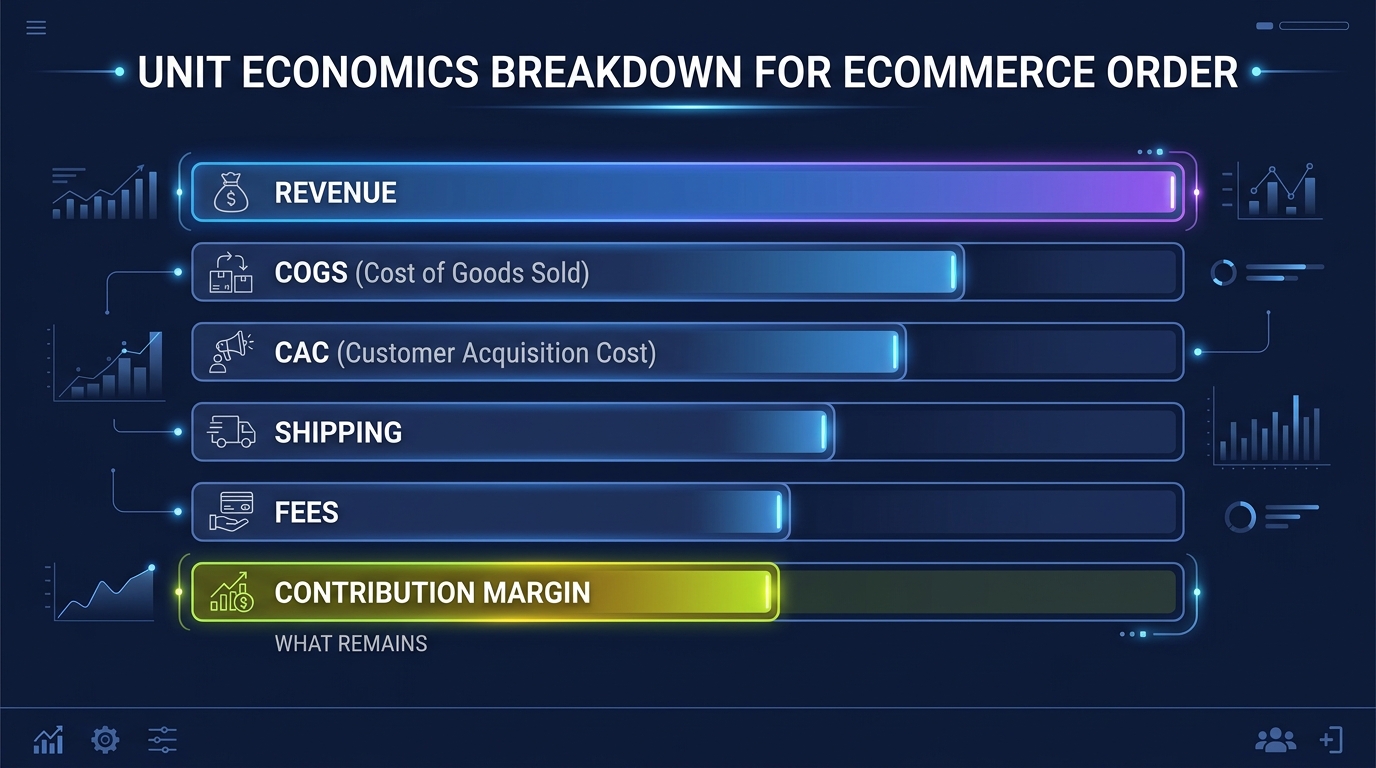
- Total variable costs (COGS, shipping, fees, returns): $35,380 (61%)
- Total profit before marketing: $22,620
- Total marketing spend: $14,500
- Blended Profit ROAS: $22,620 / $14,500 = 1.56x
For every dollar spent on marketing, you generated $1.56 in profit. After paying the $1 in marketing cost, you keep $0.56.
That is the real return on your marketing investment. Not 4x. Not 5x. $0.56 per dollar.
Suddenly the decision framework changes. Scaling marketing is not obviously profitable at 1.56x. You need to either:
- Improve margins (reduce COGS, negotiate shipping)
- Improve conversion rates (same spend, more customers)
- Increase repeat purchases (amortize CAC over more orders)
What Okiela Shows You
Okiela's profit dashboard gives you per-channel profit breakdown, not just revenue attribution. When you upload your Shopify data, you see:
- Revenue by channel (from your actual Shopify data, no overlap)
- Cost of goods and variable costs allocated per channel
- Actual profit contribution per channel
- Which channels are profitable and which are subsidized
This is the "bird's eye view" that the fitness equipment founder — and every founder I talk to — is asking for. Not three different dashboards with three different stories. One source of truth showing where money actually goes.
Upload your data once, see the complete picture in 30 seconds. Free plan covers 3 analyses per month.
The ads are not lying to you. They are just telling you their version of the story. Blended ROAS tells the business's version. And the business's version is the one that shows up in your bank account.
Find the hidden profit leaks draining your store.
Send one order export. Get your 3 biggest profit leaks back within 48 hours.
Request a free Profit Leakage AuditFree, founder-run, no pitch unless you ask. Every number labeled Verified or Estimated. Remove customer PII before upload.
Enjoyed this article?
Get weekly profit optimization tips and Okiela product news delivered to your inbox.
No spam. Unsubscribe anytime.
Nguyen Tuan Dai
Founder & CEO, Okiela
FP&A analyst building ecommerce tools on the side. Helping founders see their real numbers since 2025.