The Cash Conversion Cycle: Why Profitable Stores Still Run Out of Cash
You can be profitable every single month and still go broke. The reason is a number called the Cash Conversion Cycle. Here is what it is and how to shorten yours.
Nguyen Tuan Dai
Founder & CEO, Okiela
Key Takeaways
- 1CCC = DIO + DSO - DPO: how many days your cash is trapped between inventory purchase and customer payment
- 2A 56-day CCC means you need ~$11K in working capital just to sustain $15K/month in revenue
- 3Shortening CCC by 15 days freed $7,600 in cash for one brand -- reinvested into ads for $22.8K more revenue
- 4Biggest lever: reduce DIO (inventory days) through smaller orders and killing dead stock
- 5Growth eats cash: every $5K in monthly COGS growth needs ~$8K in additional working capital at 50-day CCC
Table of Contents (9 sections)
There is a concept in finance called the Cash Conversion Cycle. It is one of those terms that sounds like it belongs in an MBA textbook, not in a Shopify founder's brain.
But it is actually the single best explanation for why profitable ecommerce businesses run out of money.
Let me explain it simply, with real numbers, and show you how to use it.
What Is the Cash Conversion Cycle?
The Cash Conversion Cycle (CCC) answers one question: How many days does it take for a dollar you spend on inventory to come back to you as cash from a customer?
That is it. No more complex than that.
If your CCC is 45 days, it means every dollar you invest in inventory takes 45 days to return as cash. During those 45 days, that dollar is "working" — sitting as inventory, then as a shipped order, then as a pending payout.
A short CCC means your cash comes back quickly. A long CCC means your cash is trapped for a long time. And the longer it is trapped, the more working capital you need to keep the business running.
The Formula (3 Components)
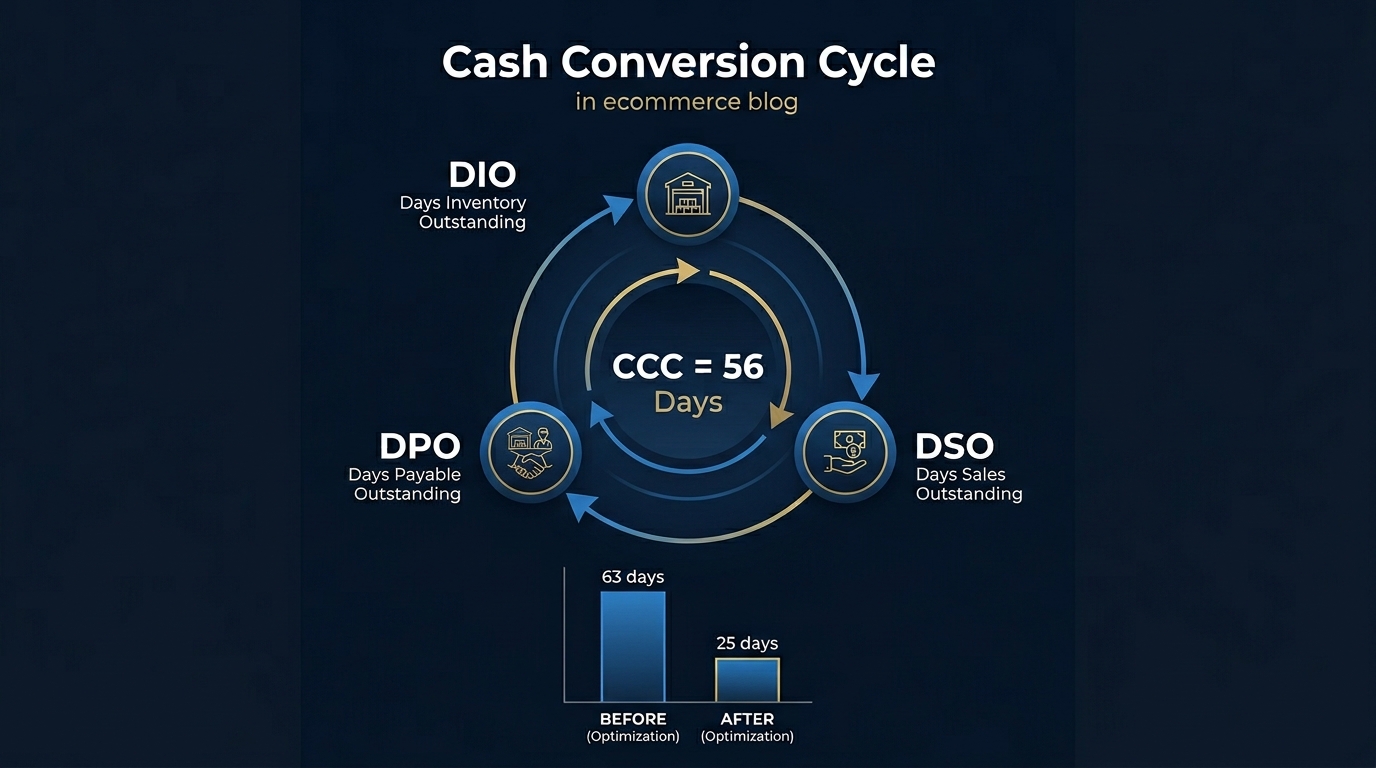
CCC = DIO + DSO - DPO
Let me translate:
DIO: Days Inventory Outstanding
How many days your inventory sits before it sells.
DIO = (Average Inventory / COGS) x 365
If your average inventory is $40,000 and your annual COGS is $180,000:
DIO = ($40,000 / $180,000) x 365 = 81 days
That means your typical product sits in your warehouse for 81 days before a customer buys it. During those 81 days, your cash is locked up in physical products.
DSO: Days Sales Outstanding
How many days between making a sale and getting cash in your bank.
For DTC ecommerce, this is usually short:
- Shopify Payments: 2-3 business days
- PayPal: 1-2 business days
- Net-30 wholesale: 30 days
If 90% of your sales are DTC (2 days DSO) and 10% are wholesale (30 days DSO):
DSO = (0.9 x 2) + (0.1 x 30) = 1.8 + 3.0 = 4.8 days
DPO: Days Payable Outstanding
How many days you have to pay your suppliers after receiving inventory.
If your supplier terms are net-30, your DPO is 30 days. If you prepay, your DPO is 0 (ouch).
DPO = (Average Accounts Payable / COGS) x 365
If you owe an average of $15,000 to suppliers and annual COGS is $180,000:
DPO = ($15,000 / $180,000) x 365 = 30 days
The Full Calculation
CCC = DIO + DSO - DPO
CCC = 81 + 4.8 - 30
CCC = 55.8 days
Your cash is tied up for 56 days on average. Every dollar you spend on inventory does not come back for almost 2 months.
Why CCC Matters More Than Profit Margin
Here is the thought experiment that makes this real:
You have a store doing $15,000/month in revenue with a 15% profit margin ($2,250/month profit).
Your CCC is 56 days. That means at any given time, you have roughly:
Cash Trapped = (COGS per Day x CCC) = ($6,000/30 x 56) = $11,200
To keep your business running, you need $11,200 in working capital at all times. Not profit — working capital. Cash that is constantly flowing through the cycle.
Now imagine you want to grow from $15K to $30K/month. Your CCC stays the same. But now:
Cash Trapped = ($12,000/30 x 56) = $22,400
You need an additional $11,200 in working capital to fund the growth. Where does that come from? Not from this month's profit ($2,250). Not from next month either.
This is the fundamental math behind "profitable stores that run out of cash." The profit is real. But the cash cycle demands more capital than the profit generates.
CCC Benchmarks for Ecommerce
| CCC | What It Means |
|---|---|
| Under 30 days | Excellent. Efficient cash cycle. Scale confidently. |
| 30-60 days | Typical for most DTC brands. Manageable but watch growth carefully. |
| 60-90 days | High. Cash is trapped too long. Focus on reducing DIO. |
| Over 90 days | Dangerous. You need external financing to sustain operations. |
For comparison: Amazon's CCC is negative (-28 days in 2025). They collect customer payments BEFORE they pay suppliers. That is the ultimate cash flow advantage.
You probably cannot achieve negative CCC. But understanding the concept shows you what world-class cash management looks like and where to aim.
How to Shorten Your CCC
Strategy 1: Reduce DIO (Inventory Days)
This is the biggest lever for most ecommerce businesses. If you can cut DIO from 81 days to 60 days, you free up:
Cash Freed = (COGS per Day x Days Reduced) = ($500/day x 21) = $10,500
$10,500 freed up without changing anything about your sales or profitability.
How to reduce DIO:
- Smaller, more frequent orders. Order 3 weeks of supply instead of 3 months.
- Faster product identification. Kill slow movers early (the 90-day dead stock audit).
- Demand forecasting. Use last 3 months of Shopify data to predict next month's demand.
- Pre-orders for new products. Do not stock until you have demand signals.
- Drop shipping for long-tail SKUs. If a product sells 2 units/month, do not hold it. Drop ship.
Strategy 2: Reduce DSO (Collection Days)
For DTC, this is already short (2-3 days with Shopify Payments). But if you do wholesale:
- Move from net-60 to net-30 terms
- Offer a 2% discount for payment within 10 days (standard "2/10 net 30" terms)
- Use Shopify Payments or similar fast-payout processors
- Avoid platforms with long payout cycles
Strategy 3: Increase DPO (Supplier Payment Days)
The longer you can delay paying suppliers, the better your cash cycle.
- Negotiate net-45 or net-60 terms. Most suppliers will negotiate if you have consistent order volume and good payment history.
- Use a business credit card. If you buy on a credit card with a 30-day billing cycle, you effectively get 30 extra days of DPO.
- Pay on the due date, not before. If terms are net-30, pay on day 29. Not day 15. Early payment is cash leaving your account unnecessarily.
Note: do NOT abuse supplier relationships. Pay on time, every time. But pay on the last day of the terms, not the first.
Real Example: Shortening CCC by 15 Days
A DTC brand selling home goods:
Before optimization:
- DIO: 75 days (ordered quarterly in bulk)
- DSO: 3 days (Shopify Payments)
- DPO: 15 days (prepaid most suppliers)
- CCC: 75 + 3 - 15 = 63 days
- Working capital needed: $12,600
After optimization (90 days later):
- DIO: 52 days (switched to monthly orders, killed 4 dead SKUs)
- DSO: 3 days (no change)
- DPO: 30 days (negotiated net-30 with primary supplier)
- CCC: 52 + 3 - 30 = 25 days
- Working capital needed: $5,000
Cash freed: $7,600. Without increasing sales by a single dollar. That $7,600 went into ad spend on their best-performing campaign and generated $22,800 in additional revenue over the next quarter.
All from shortening the time between spending money and getting it back.
The CCC Growth Calculator
Here is a quick formula to estimate how much extra cash you need to fund growth:
Additional Working Capital = (Monthly COGS Increase x CCC) / 30
If you want to grow COGS by $5,000/month (roughly $12,500 in additional revenue at 40% COGS) and your CCC is 50 days:
Additional capital needed = ($5,000 x 50) / 30 = $8,333
That is $8,333 in cash you need to fund the growth before the growth pays for itself. If your monthly profit is $3,000, it will take almost 3 months of accumulated profit to fund one month of growth.
This is why fast-growing ecommerce brands always seem to need capital — even profitable ones. Growth literally consumes cash faster than profits generate it, unless you shorten your CCC.
The Weekly Cash Cycle Review
Add this to your Monday morning routine (takes 5 minutes):
- 1Check inventory levels. Any SKU with more than 60 days of supply? Flag it.
- 2Check pending payouts. Any delayed Shopify payouts or slow-paying wholesale customers?
- 3Check upcoming supplier payments. What is due this week? Is there cash to cover it?
These three checks, done weekly, prevent cash flow surprises. No founder should ever be blindsided by a cash crunch. The numbers are always available — you just have to look at them regularly.
What Okiela Shows You
Okiela calculates your per-SKU and per-order profitability from your Shopify export. This gives you the exact data points needed to calculate your CCC:
- COGS per product: For accurate DIO calculation
- Revenue and cost timing: When money comes in vs when it goes out
- SKU-level margins: Which products to keep and which to cut (directly affects DIO)
- Profit waterfall: See exactly where cash gets trapped between GMV and True Profit
Upload your data, see your real margins, and use those numbers to optimize your cash conversion cycle. The founders who understand their CCC grow faster, sleep better, and never get blindsided by a cash crunch.
Free plan. 3 analyses per month. Because the number one reason ecommerce stores fail is not lack of sales. It is running out of cash before the sales turn into profit.
Find the hidden profit leaks draining your store.
Send one order export. Get your 3 biggest profit leaks back within 48 hours.
Request a free Profit Leakage AuditFree, founder-run, no pitch unless you ask. Every number labeled Verified or Estimated. Remove customer PII before upload.
Enjoyed this article?
Get weekly profit optimization tips and Okiela product news delivered to your inbox.
No spam. Unsubscribe anytime.
Nguyen Tuan Dai
Founder & CEO, Okiela
FP&A analyst building ecommerce tools on the side. Helping founders see their real numbers since 2025.