How to Calculate Your Real Inventory Carrying Cost (It Is Not Just Storage)
That inventory sitting in your warehouse is not free. It costs 20-30% of its value per year in hidden carrying costs. Here is how to calculate yours.
Nguyen Tuan Dai
Founder & CEO, Okiela
Key Takeaways
- 1Real inventory carrying cost is 20-30% of inventory value per year -- not just storage fees
- 25 components: storage (5-10%), capital/opportunity cost (8-15%), depreciation (3-8%), insurance (1-3%), shrinkage (1-3%)
- 3$50K in inventory costs $14,250/year just to hold -- that is $1,187/month eating your profit
- 4SKUs taking 90+ days to sell cost 3x more in carrying costs than 30-day sellers
- 5Smaller, more frequent orders often save more in carrying costs than they lose in bulk discounts
Table of Contents (6 sections)
Here is a question I ask every Shopify founder I work with: "How much does it cost you to hold $50,000 worth of inventory for a year?"
Most people say "storage fees" and guess $200-$300 a month.
The real answer is $10,000-$15,000 per year. Twenty to thirty percent of the inventory's value.
That gap between what founders think inventory costs and what it actually costs is one of the biggest blind spots in ecommerce. Let me show you where the money goes.
What Is Inventory Carrying Cost?
Inventory carrying cost (also called holding cost) is the total cost of owning and storing unsold inventory. It includes everything: the warehouse space, the money tied up in those products, the risk that they will not sell, and the insurance that covers them.
The standard formula:
Carrying Cost % = (Total Carrying Costs / Average Inventory Value) x 100
For most ecommerce businesses, this number lands between 20% and 30% annually. That means for every $100 of inventory sitting on your shelves, you are spending $20-$30 per year just to HOLD it.
The 5 Components of Carrying Cost
Component 1: Storage Costs (5-10% of inventory value)
This is the obvious one. Warehouse rent, utilities, racking, and labor to maintain the space.
If you use a 3PL (third-party logistics), your storage costs show up as line items on your monthly invoice. Typical rates:
- Pallet storage: $15-$40/pallet/month
- Bin storage: $3-$8/bin/month
- Per-cubic-foot: $0.50-$1.50/month
If you are storing at home or in a small rented space:
- Calculate the square footage dedicated to inventory
- Multiply by your rent per square foot
- Add utilities (proportional)
- That is your monthly storage cost
Example: $50K in inventory using 200 sq ft of warehouse at $12/sq ft = $2,400/year in rent alone. Add utilities and handling labor: roughly $4,000/year. That is 8% of inventory value.
Component 2: Capital Cost / Opportunity Cost (8-15% of inventory value)
This is the biggest component and the one almost nobody tracks.
Your money is tied up in inventory. That money could be somewhere else — earning interest, paying down debt, funding advertising, or just sitting in a savings account.
If you have $50,000 in inventory:
- At minimum, that money could earn 4-5% in a high-yield savings account
- If you used it for ad spend instead and got a 3x ROAS, the opportunity cost is much higher
- If you borrowed money to buy inventory (credit card, loan, Shopify Capital), the cost is the interest rate you are paying
The real cost of capital for most small ecommerce businesses is 10-15% per year. This is a blend of actual interest payments, credit card interest, and the opportunity cost of not deploying that cash elsewhere.
On $50K inventory, capital cost = $5,000-$7,500/year.
Component 3: Depreciation / Obsolescence (3-8% of inventory value)
Products lose value over time. Fashion items depreciate fast. Electronics get outdated. Seasonal products become unsellable after the season.
Realistic depreciation rates:
- Fashion/apparel: 15-25% per year (fast fashion cycles)
- Seasonal products: 30-50% if not sold in season
- Beauty/wellness: 10-20% (expiration concerns)
- Electronics accessories: 8-15% (technology moves fast)
- Evergreen products: 3-5% (minimal depreciation)
Your depreciation rate depends on your product mix. But even "evergreen" products depreciate at 3-5% because of:
- New competitor products entering the market
- Customer preference shifts
- Packaging wear and tear in storage
- Color/style trends evolving
On $50K inventory with a blended 5% depreciation: $2,500/year.
Component 4: Insurance (1-3% of inventory value)
If your inventory is insured (it should be), you are paying a premium based on the total value.
Typical ecommerce inventory insurance: 1-2% of inventory value per year.
On $50K: $500-$1,000/year.
If you are NOT insuring your inventory, you are essentially self-insuring. The cost is zero until a fire, flood, theft, or damage event happens — and then it is 100%.
Component 5: Shrinkage (1-3% of inventory value)
Shrinkage is inventory loss from theft, damage, administrative errors, and supplier fraud.
The National Retail Federation reports average shrinkage of 1.4% for retail. For small ecommerce operations with less formalized inventory controls, 2-3% is common.
Types of shrinkage:
- Warehouse damage (dropped boxes, water damage, rodents): 0.5-1%
- Administrative errors (miscounts, mislabels, shipping wrong items): 0.5-1%
- Theft (employee or warehouse): 0.3-0.5%
- Supplier short-ships (you ordered 100, received 97): 0.2-0.5%
On $50K: $750-$1,500/year.
The Full Carrying Cost Calculation
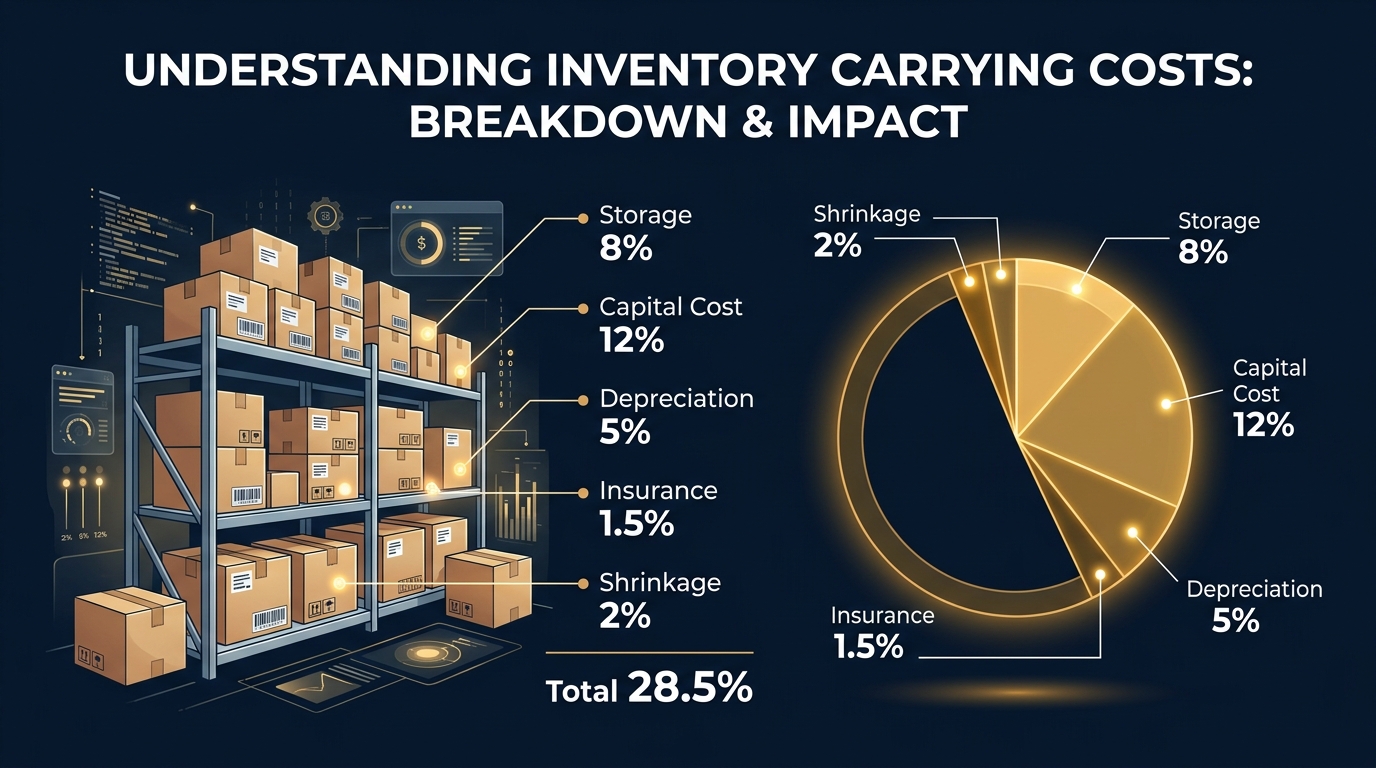
Adding it all up for $50,000 in average inventory:
| Component | % of Value | Annual Cost |
|---|---|---|
| Storage | 8% | $4,000 |
| Capital / Opportunity | 12% | $6,000 |
| Depreciation | 5% | $2,500 |
| Insurance | 1.5% | $750 |
| Shrinkage | 2% | $1,000 |
| Total Carrying Cost | 28.5% | $14,250 |
$14,250 per year to hold $50,000 in inventory. That is $1,187 per month.
If your monthly profit is $5,000, your inventory carrying costs are eating 24% of it.
Why This Matters for Pricing and Ordering
You are probably over-ordering
If holding inventory costs 28.5% per year, every dollar of excess inventory costs you $0.285. A $5,000 over-order costs $1,425 in carrying costs before you sell a single extra unit.
The fix: Calculate your optimal reorder point and quantity. Formula:
Reorder Point = (Average Daily Sales x Lead Time in Days) + Safety Stock
Safety stock = Average Daily Sales x Lead Time x Safety Factor (typically 1.5-2x)
Slow-moving inventory is a profit killer
A SKU that takes 90 days to sell costs 3x more to carry than a SKU that sells in 30 days. If two SKUs have the same margin but different sell-through rates, the fast mover is MUCH more profitable after carrying costs.
The fix: Calculate your inventory turnover ratio per SKU:
Inventory Turnover = Cost of Goods Sold / Average Inventory
Then calculate days of inventory on hand:
Days on Hand = 365 / Inventory Turnover
Target: 30-60 days for most ecommerce. Above 90 days, that SKU is a cash trap.
Your true product margin is lower than you think
If you price based on COGS and gross margin but ignore carrying costs, your real margin is 3-5 percentage points lower.
A product with 50% gross margin and 90 days sitting in your warehouse has an effective margin of around 43% after carrying costs. Price accordingly.
5 Ways to Reduce Inventory Carrying Cost
1. Reduce days on hand
Smaller, more frequent orders. Yes, you might pay more per unit without bulk discounts. But the savings in carrying costs often outweigh the lost discount. Do the math for your specific products.
2. Negotiate consignment terms
Some suppliers will hold inventory for you and only charge when it ships. You eliminate carrying costs entirely on consignment products. Worth negotiating, especially with new product lines.
3. Use a pre-order model for new products
Test demand before committing cash. A pre-order campaign tells you exactly how many units to order. Zero overstock. Zero carrying cost on unsold units.
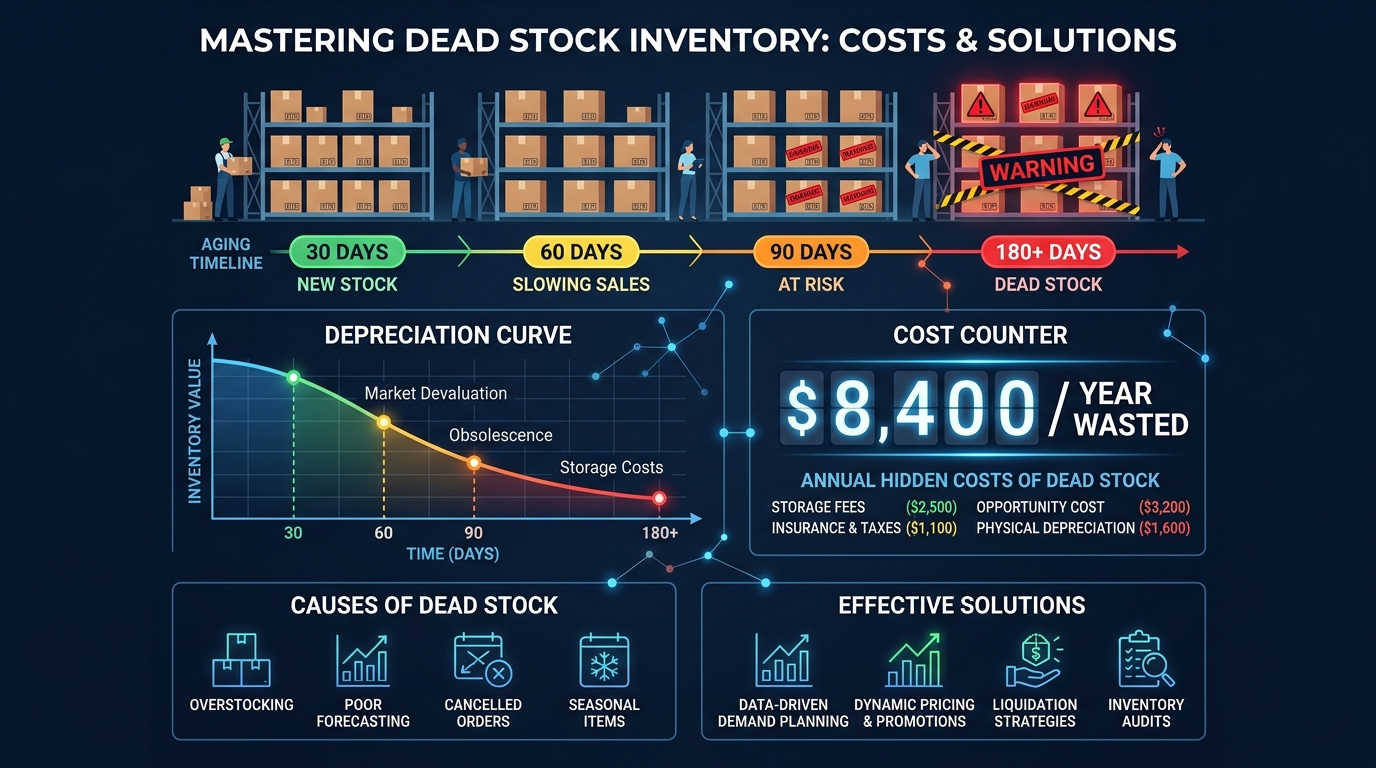
4. Implement dead stock reviews quarterly
Every quarter, review any SKU with more than 90 days of inventory on hand. Decide: liquidate, bundle, or write off. Holding dead stock is the most expensive form of carrying cost because the depreciation accelerates.
5. Track inventory carrying cost in your profit analysis
This is where most founders fail. They track COGS. They track shipping. They track ad spend. But they never allocate carrying costs to individual SKUs.
Upload your Shopify data to Okiela. The profit engine shows per-SKU margins. When you add your COGS data, you can see which products have healthy margins and fast turnover (keep) versus thin margins and slow turnover (fix or kill).
Free plan includes 3 analyses per month. Start with your top 20 SKUs and calculate their true profitability including carrying costs. The results usually shift your priorities significantly.
The Bottom Line
That inventory on your shelves is not an asset sitting there waiting to become money. It is an asset that is actively losing 20-30% of its value every year just by existing.
Every dollar of inventory carries a hidden tax. The faster you turn it into cash, the less tax you pay. The slower it sits, the more it eats your profit.
Track your carrying cost. Calculate it per SKU. And factor it into every purchasing decision you make. Because the cheapest inventory is the inventory you never had to hold.
Find the hidden profit leaks draining your store.
Send one order export. Get your 3 biggest profit leaks back within 48 hours.
Request a free Profit Leakage AuditFree, founder-run, no pitch unless you ask. Every number labeled Verified or Estimated. Remove customer PII before upload.
Enjoyed this article?
Get weekly profit optimization tips and Okiela product news delivered to your inbox.
No spam. Unsubscribe anytime.
Nguyen Tuan Dai
Founder & CEO, Okiela
FP&A analyst building ecommerce tools on the side. Helping founders see their real numbers since 2025.