Dead Stock Is Eating Your Profit: How to Find It, Fix It, and Prevent It
Somewhere in your warehouse, products are sitting there costing you money every day. The average ecommerce store has 20-30% of its inventory in dead or slow-moving stock. Here is how to deal with it.
Nguyen Tuan Dai
Founder & CEO, Okiela
Key Takeaways
- 1Average ecommerce store has 20-30% of inventory as dead or slow-moving stock
- 2$28K in dead stock costs ~$8,400/year in carrying costs plus massive opportunity cost
- 390-day audit takes 20 minutes: export inventory, cross-reference with sales, flag zero-sale SKUs
- 45 liquidation strategies: bundle with bestsellers, VIP email flash sale, secondary channels, donate for tax deduction, write off
- 5Prevention: never order more than 60 days supply for new products, test before committing, monthly age review
Table of Contents (6 sections)
I was helping a Shopify founder with her numbers last month. Her store does $60K/month. Margins looked healthy. Growth was solid.
Then I asked about inventory.
"How much inventory do you currently have?"
"About $85,000 worth."
"How much of that has been sitting for more than 90 days?"
Silence. She had never calculated it.
We pulled the data. $28,000 — 33% of her total inventory — had not sold a single unit in over 90 days. Some of it had been there for 6+ months.
That $28,000 in dead stock was costing her roughly $700 per month in carrying costs alone. $8,400 per year. Plus the opportunity cost of tying up $28K that could be used for fast-selling inventory, ad spend, or literally anything else.
She was profitable. She could have been significantly MORE profitable if that $28K was not sitting on shelves collecting dust.
What Counts as "Dead Stock"?
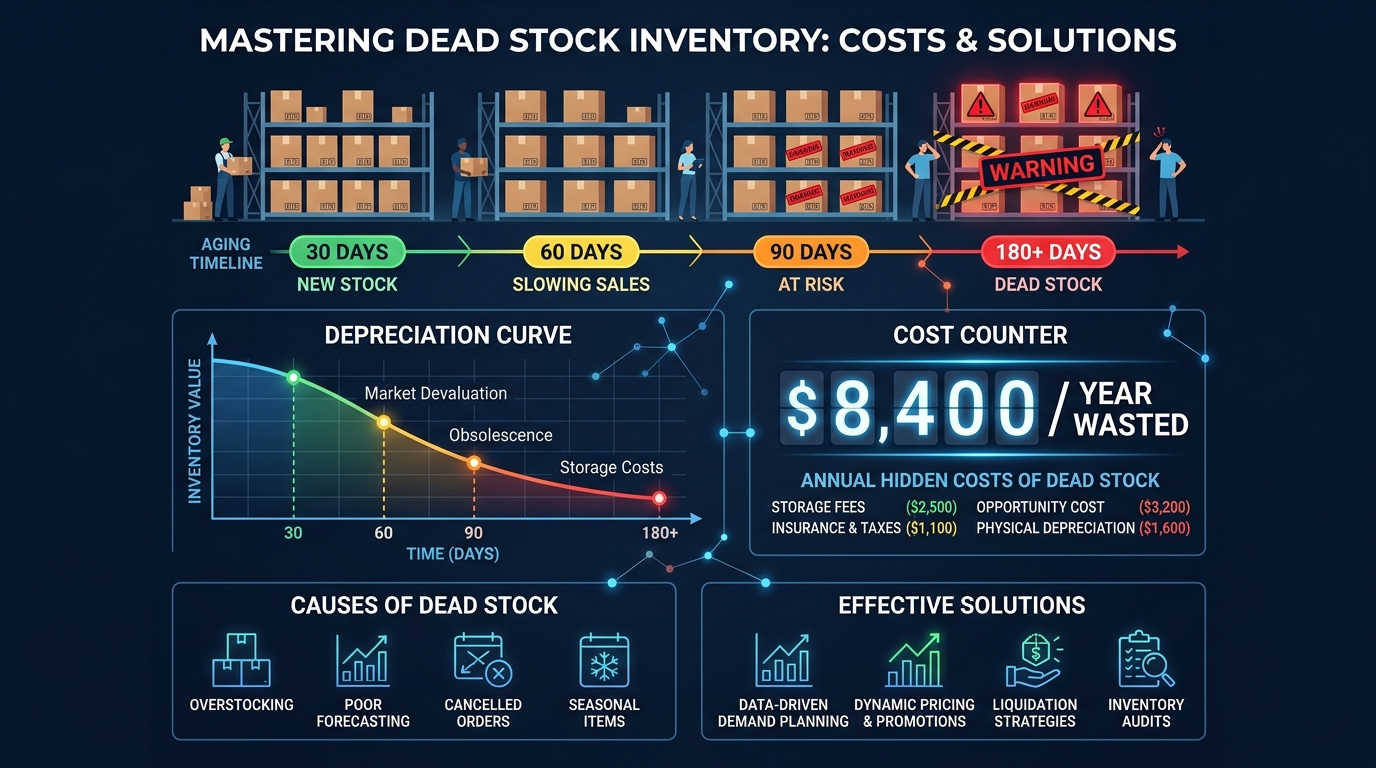
Dead stock is inventory that has not sold within a defined period and is unlikely to sell at full price. Different businesses define the cutoff differently, but here is a practical framework:
| Category | Days Without Sale | Status |
|---|---|---|
| Healthy | 0-30 days | Normal inventory turnover |
| Slow-moving | 31-60 days | Watch closely, consider repricing |
| At-risk | 61-90 days | Active intervention needed |
| Dead stock | 90+ days | Liquidate, bundle, or write off |
| Zombie stock | 180+ days | Write off immediately |
For most ecommerce businesses, anything past 90 days with no sales should be flagged as dead stock. It is costing you money every day, and the longer it sits, the less recoverable value it has.
The Real Cost of Dead Stock
Dead stock does not just sit there passively. It actively drains your business in 5 ways:
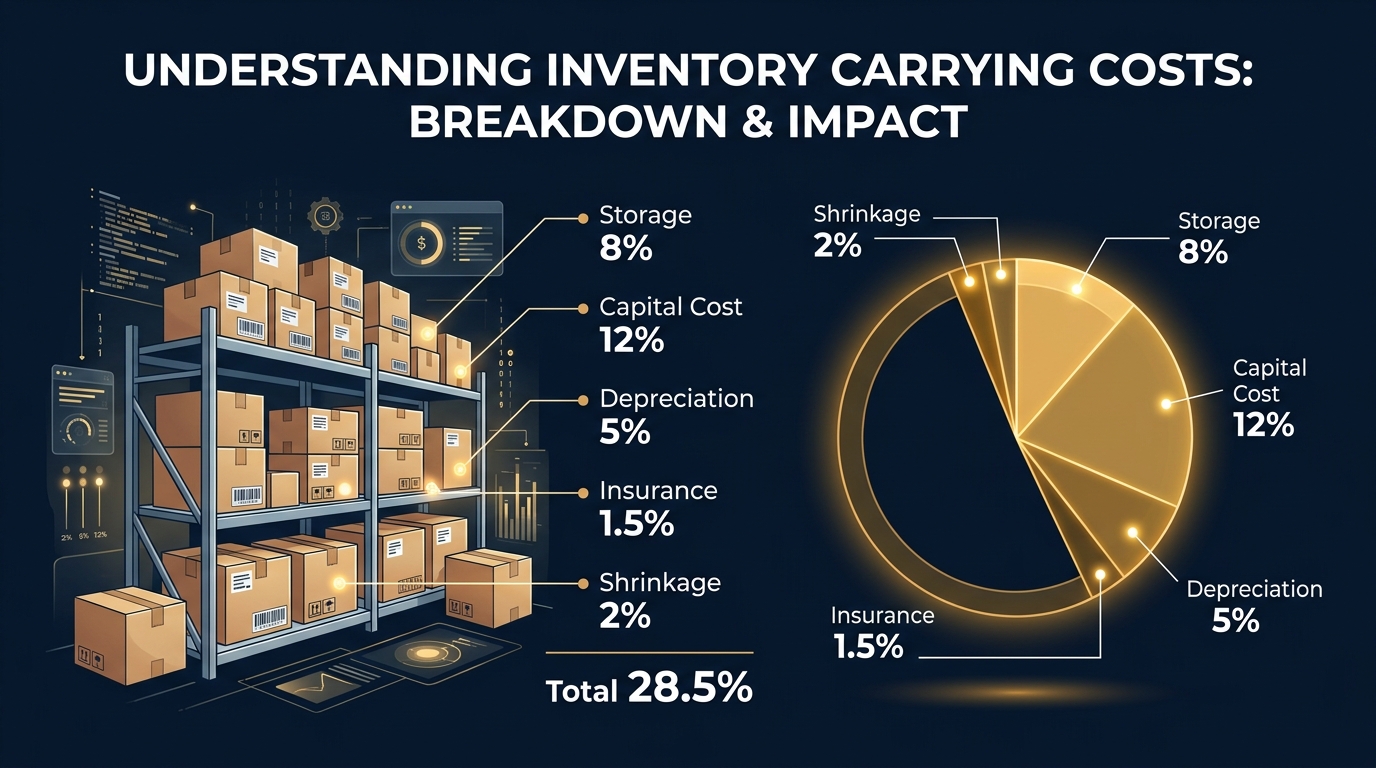
Cost 1: Carrying costs (20-30% of value annually)
We covered this in detail in the inventory carrying cost article. Storage, capital, depreciation, insurance, shrinkage — all of these apply to dead stock, but the depreciation component accelerates because the products are actively losing market value.
$28K in dead stock at 30% carrying cost = $8,400/year in pure waste.
Cost 2: Opportunity cost
That $28K of capital is frozen. If you invested it in fast-moving inventory with 50% margin and 4x annual turns, it would generate $56K in annual profit. Instead, it generates zero.
Cost 3: Warehouse space
Dead stock occupies physical space that fast-selling products need. If your 3PL charges per pallet and dead stock takes up 10 pallets at $30/month, that is $300/month — $3,600/year — in wasted space.
Cost 4: Psychological cost
Dead stock creates decision paralysis. Founders feel guilty about "giving up" on products they invested in. So the stock sits there another month. And another. The sunk cost fallacy keeps bad inventory on shelves.
Cost 5: Tax implications
In many jurisdictions, you cannot deduct the full cost of inventory until it is sold or written off. Dead stock that you refuse to write off stays on your books as an "asset" — an asset that is actively shrinking in real value while maintaining its book value.
The 90-Day Dead Stock Audit (20 Minutes)
Here is exactly how to find your dead stock:
Step 1: Export your inventory list from Shopify
Go to Products > Export. You need: SKU, product name, inventory quantity, and created date.
Step 2: Export your sales data for the last 90 days
Go to Analytics > Reports > Sales by product. Export as CSV.
Step 3: Cross-reference
For every SKU in your inventory, check if it had ANY sales in the last 90 days. Flag SKUs with zero sales.
Step 4: Calculate the damage
For each dead stock SKU, multiply: Units on Hand x Unit COGS = Capital Trapped
Add them all up. That is your dead stock dollar exposure.
Step 5: Categorize by age
- 90-120 days: Intervention zone — still recoverable
- 120-180 days: Liquidation zone — sell at discount or bundle
- 180+ days: Write-off zone — donate, destroy, or fire-sale
5 Strategies to Liquidate Dead Stock
Strategy 1: Bundle with best sellers
Take your dead stock and create a bundle with your top-selling product. "Buy our best-selling serum, get a free travel-size cleanser." The cleanser is dead stock. The serum is your hero product.
Customer perceives added value. You move dead stock. Your average margin on the bundle is still positive because the hero product carries the economics.
This works especially well when dead stock is lower-priced items or complementary products.
Strategy 2: Flash sale to email list only
Do not run a public sitewide sale. Instead, send a "VIP clearance" email to your existing customers only. Frame it as exclusive access.
Price dead stock at 40-60% off. Your goal is not margin — it is cash recovery. Getting 50 cents back on every dollar beats getting zero while paying carrying costs.
Limiting it to email avoids training new customers to expect discounts.
Strategy 3: Sell on a secondary channel
List dead stock on Amazon, eBay, Facebook Marketplace, or liquidation platforms (like B-Stock or BULQ). These channels reach bargain hunters who are different from your main customer base.
The price will be lower. The fees will be higher. But recovering 30-40% of COGS is better than writing off 100%.
Strategy 4: Donate for tax deduction
In many countries, donating inventory to a registered charity is tax-deductible at the cost basis (what you paid for it). If your dead stock cost $10,000 and your effective tax rate is 25%, a donation saves you $2,500 in taxes.
That is $2,500 you would lose anyway if the stock depreciated to zero. At least this way you get a tax benefit and some goodwill.
Strategy 5: Write it off and move on
Sometimes the best decision is the hardest: write it off. Remove it from your warehouse. Take the accounting loss. Free up the space and mental energy for products that actually sell.
The sunk cost fallacy says "but I paid $10 per unit." The economic reality says that unit is worth $0 if nobody wants to buy it.
Write it off. Move on. Reinvest the freed capital in winners.
How to Prevent Dead Stock in the Future
Prevention 1: Never order more than 60 days of supply
For new products with uncertain demand, order 30 days of projected supply. If it sells well, reorder. If it does not, your exposure is limited.
For proven products, 45-60 days of supply balances bulk discounts against carrying cost risk.
Prevention 2: Test before committing
Use pre-orders or small test batches to validate demand before large orders. If 50 people pre-order a new product, you know to order 200-300 units (accounting for marketing reach). If 5 people pre-order, you know to order 50 and test more.
Prevention 3: Set automatic reorder alerts
In Shopify, set up low-stock notifications at your reorder point. This prevents both stockouts (lost sales) and over-ordering (future dead stock).
Reorder point = (Average daily sales x Lead time) + Safety stock
Prevention 4: Monthly inventory age review
Every month, run the 90-day audit above. Make it a 15-minute standing meeting with yourself. The earlier you catch slow movers, the more options you have and the more value you can recover.
Prevention 5: Track sell-through rate per SKU
Sell-through rate = Units Sold / (Units Sold + Units on Hand) over a period
Healthy: 80%+ sell-through in 90 days
Warning: 50-80%
Danger: Below 50%
Any SKU below 50% sell-through over 90 days is heading toward dead stock territory.
What Okiela Shows You
Okiela's profit dashboard gives you per-SKU profitability — the exact data you need to decide which products are worth reordering and which are candidates for liquidation.
When you upload your Shopify data:
- The AI identifies your lowest-margin SKUs
- You see contribution margin per product after ALL costs
- The profit waterfall shows how much of your cash is trapped in low-performing inventory
- You can compare margin per SKU against your sell-through rate to find the real money drains
Upload your data. See which products are making money and which are eating it. Then run the 90-day audit on the losers.
Free plan includes 3 analyses per month. That is enough to audit your entire catalog and make informed decisions about every SKU.
Because dead stock is not a problem that fixes itself. It just gets more expensive every day you ignore it.
Find the hidden profit leaks draining your store.
Send one order export. Get your 3 biggest profit leaks back within 48 hours.
Request a free Profit Leakage AuditFree, founder-run, no pitch unless you ask. Every number labeled Verified or Estimated. Remove customer PII before upload.
Enjoyed this article?
Get weekly profit optimization tips and Okiela product news delivered to your inbox.
No spam. Unsubscribe anytime.
Nguyen Tuan Dai
Founder & CEO, Okiela
FP&A analyst building ecommerce tools on the side. Helping founders see their real numbers since 2025.