Ecommerce Cash Flow Management for Founders Who Hate Finance
Your P&L says you made $8K last month. Your bank account says $400. The problem is not your math — it is the timing of your money. Here is how cash flow actually works.
Nguyen Tuan Dai
Founder & CEO, Okiela
Key Takeaways
- 1Profit and cash are not the same -- a store with $8K profit can have $400 in the bank
- 2Cash flow timing: you pay for inventory 45 days before Shopify pays you for the sale
- 3A 13-week cash flow forecast takes 30 minutes to set up and prevents cash crises
- 43 levers: accelerate cash in (faster payouts, flash sales), decelerate cash out (negotiate terms), secure a bridge (Shopify Capital)
- 5Growth eats cash -- every dollar of new inventory is paid from past revenue that is always smaller
Table of Contents (7 sections)
A founder I work with closed January with $8,200 in profit. Solid month. Good margins. Healthy growth.
Then he tried to pay his February inventory invoice. Insufficient funds.
$8,200 in profit. Cannot cover a $12,000 inventory bill. He called me confused and a little scared.
"I thought I was profitable?"
He was. On paper. But profit and cash are two completely different things. And understanding the difference is literally the difference between a business that survives and one that closes while technically being "profitable."
Let me explain this the way I wish someone had explained it to me.
Profit Is Not Cash
This is the single most important financial concept for any founder. And it is the one most people get wrong.
Profit is an accounting concept. It says: "During this period, your revenues exceeded your costs."
Cash is a physical reality. It says: "Right now, in this moment, this is how much money is in your bank account."
They are related but they are NOT the same thing. Here is why:
Timing. You buy inventory in January. You sell it in February. You get paid by Shopify in March (after their 2-3 day payout delay). Your profit "happened" in February. But the cash did not arrive until March, and the cash LEFT in January.
For 60 days, you were profitable but had less cash than when you started.
This is not a bug. It is how every product business works. But if you do not plan for it, it will kill you.
The Cash Flow Timeline of a Typical Order
Let me trace the cash flow of a single $80 order:
Day -45: You order inventory
You send your supplier $32 per unit (COGS at 40%). Payment due on order. Cash goes OUT.
Day -30: Inventory arrives
You pay for freight: $2.40 per unit. Cash goes OUT.
Day 0: Customer places order
They pay $80. But Shopify does not send you the money immediately.
Day +2: Shopify payout
You receive $80 minus payment processing fee ($2.62). Net received: $77.38. Cash comes IN.
Day +2: You ship the order
Carrier charges $8.50. Cash goes OUT.
Day +5: Advertising bill
Meta charges your credit card for the ads that brought this customer. Allocated cost: $18 per order. Cash goes OUT (or went out already on the 1st of the month).
Day +14: Customer requests return (12% probability)
If they return it, you refund $80. Cash goes OUT. Plus $8.50 return label. Plus $5 restocking. Plus $2.62 payment fee you never get back.
The math:
| Event | Day | Cash Impact |
|---|---|---|
| Buy inventory | -45 | -$34.40 |
| Customer pays | +2 | +$77.38 |
| Ship order | +2 | -$8.50 |
| Ad spend (allocated) | +5 | -$18.00 |
| Shopify plan + apps (allocated) | +30 | -$2.00 |
| Net cash per order | -- | +$14.48 |
If the customer returns (12% chance):
| Return processing | +14 | -$96.12 |
|---|
On average, accounting for returns: $14.48 x 88% + (-$81.64) x 12% = $2.95 net cash per order
That is why your bank account feels emptier than your P&L suggests.
Why Profitable Stores Go Broke
Three scenarios that kill cash flow in profitable businesses:
Scenario 1: Inventory Pre-Buy for Growth
You are growing. You need more inventory. You order $25,000 for next month's projected sales. But this month's sales only generated $15,000 in cash. You are $10,000 short.
Growth eats cash. Every dollar of inventory you buy TODAY is paid for with PAST revenue. If you are growing fast, past revenue is always smaller than current demand.
Scenario 2: Seasonal Inventory Build-Up
You stock up for Black Friday in September. You spend $40,000 on inventory. But BFCM revenue does not arrive until November-December. For two months, that $40,000 is sitting on your shelves, not in your bank.
Scenario 3: Supplier Payment Terms Change
Your supplier moves from net-30 to net-15. Suddenly you need to pay inventory invoices two weeks earlier. If you are running tight on cash, those two weeks can be the difference between staying open and shutting down.
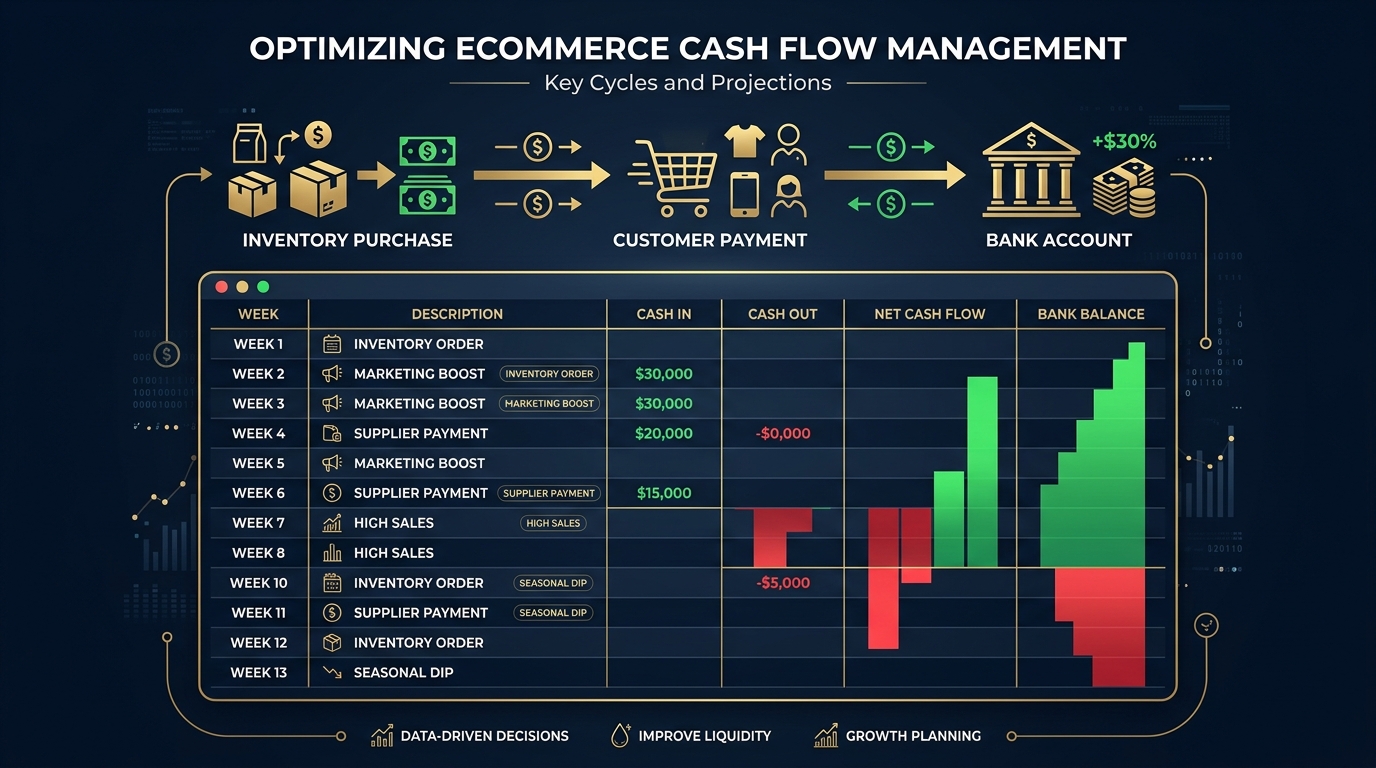
The 13-Week Cash Flow Forecast
Here is the tool that prevents all three scenarios. It takes 30 minutes to set up and 15 minutes per week to maintain.
A 13-week cash flow forecast is exactly what it sounds like: a week-by-week projection of cash coming in and cash going out for the next 3 months.
How to build it:
Step 1: Opening balance. What is in your bank account right now.
Step 2: Weekly cash IN. Projected Shopify payouts based on expected sales. Use last month's weekly average as a starting point. Adjust for known events (sales, launches, seasonal trends).
Step 3: Weekly cash OUT. Map every outflow:
- Inventory orders (when they ship, not when you receive them)
- Shipping costs (weekly)
- Ad spend (when the credit card gets charged)
- Payroll and freelancers (when they get paid)
- Shopify + apps (monthly billing date)
- Rent, insurance, other fixed costs
- Tax payments (quarterly)
Step 4: Calculate weekly ending balance. Starting balance + cash in - cash out = ending balance. That ending balance becomes next week's starting balance.
Step 5: Look for the red weeks. Any week where the ending balance goes below your minimum safe level (I recommend 2 weeks of operating expenses), you need to act NOW.
Example:
| Week | Starting | Cash In | Cash Out | Ending |
|---|---|---|---|---|
| Week 1 (now) | $18,000 | $9,500 | -$7,200 | $20,300 |
| Week 2 | $20,300 | $10,200 | -$22,000* | $8,500 |
| Week 3 | $8,500 | $9,800 | -$8,100 | $10,200 |
| Week 4 | $10,200 | $11,000 | -$6,500 | $14,700 |
*Week 2 has a large inventory payment.
Without this forecast, Week 2 would have been a nasty surprise. With it, you see the cash crunch coming 2 weeks early and can plan for it.
The 3 Levers to Fix Cash Flow
When your forecast shows a cash crunch, you have three levers:
Lever 1: Accelerate Cash In
- Invoice faster. If you have wholesale or B2B customers, send invoices immediately, not at month-end.
- Reduce Shopify payout delay. Shopify Payments pays in 2-3 business days. Some gateways pay daily. Consider switching if cash timing is critical.
- Collect deposits on large orders. If you do custom or wholesale, collect 50% upfront.
- Run a flash sale. Sometimes you need cash NOW. A 48-hour sale with existing inventory converts to cash fast.
Lever 2: Decelerate Cash Out
- Negotiate supplier terms. Ask for net-45 or net-60 instead of net-30. Most suppliers will negotiate if you have a good payment history.
- Stagger inventory orders. Instead of one big order per month, do smaller weekly orders. You keep less cash tied up in inventory at any given time.
- Reduce ad spend temporarily. If you are cash-constrained, cut your lowest-performing campaigns for 2-4 weeks. Focus on email and organic.
- Pause non-essential app subscriptions. That analytics tool you use once a month? Cancel it. Save $50-$100.
Lever 3: Secure a Bridge
- Shopify Capital. Revenue-based financing. They take a % of daily sales until repaid. Fast approval, no equity.
- Revenue-based lending (Clearco, Wayflyer). Specifically designed for ecommerce cash flow gaps.
- Business line of credit. Keep one open for emergencies. You only pay interest when you draw on it.
- Personal savings (last resort). Founders put in their own cash when they have to. Just set a hard limit and do not exceed it.
The key is to see the crunch BEFORE it happens. That is why the 13-week forecast exists.
The Weekly Cash Habit
Every Monday morning, spend 15 minutes:
- 1Update your 13-week forecast with actual numbers from last week
- 2Check your bank balance vs forecast. Are you ahead or behind?
- 3Look at the next 4 weeks. Any red weeks?
- 4If yes, pull one of the three levers NOW. Not next week. Now.
This single habit prevents more business failures than any marketing tactic or product strategy.
What Okiela Shows You
When you upload your Shopify data to Okiela, the profit waterfall shows you exactly where your money goes at each level. But more importantly, it shows you the GAP between profit and cash.
Specifically:
- Your true per-order profit (after ALL costs, not just COGS)
- How much of that profit is eaten by cash timing (inventory pre-buys, delayed payouts)
- Which SKUs contribute the most to your cash flow (high-margin, fast-turning)
- Which SKUs are cash traps (low-margin, slow-turning, tying up inventory dollars)
The AI highlights products that are profitable but bad for cash flow — the ones where you buy expensive inventory that sits for weeks before selling. These are the silent killers.
Upload your Shopify export for free. See your real profit per order and per SKU in 30 seconds. Then build your 13-week forecast with real numbers instead of guesses.
Because the saddest sentence in business is: "We were profitable. We just ran out of cash."
Find the hidden profit leaks draining your store.
Send one order export. Get your 3 biggest profit leaks back within 48 hours.
Request a free Profit Leakage AuditFree, founder-run, no pitch unless you ask. Every number labeled Verified or Estimated. Remove customer PII before upload.
Enjoyed this article?
Get weekly profit optimization tips and Okiela product news delivered to your inbox.
No spam. Unsubscribe anytime.
Nguyen Tuan Dai
Founder & CEO, Okiela
FP&A analyst building ecommerce tools on the side. Helping founders see their real numbers since 2025.