The Ecommerce Cashflow Timeline: Why Cash Goes Out on Day 0 but Comes Back on Day 45
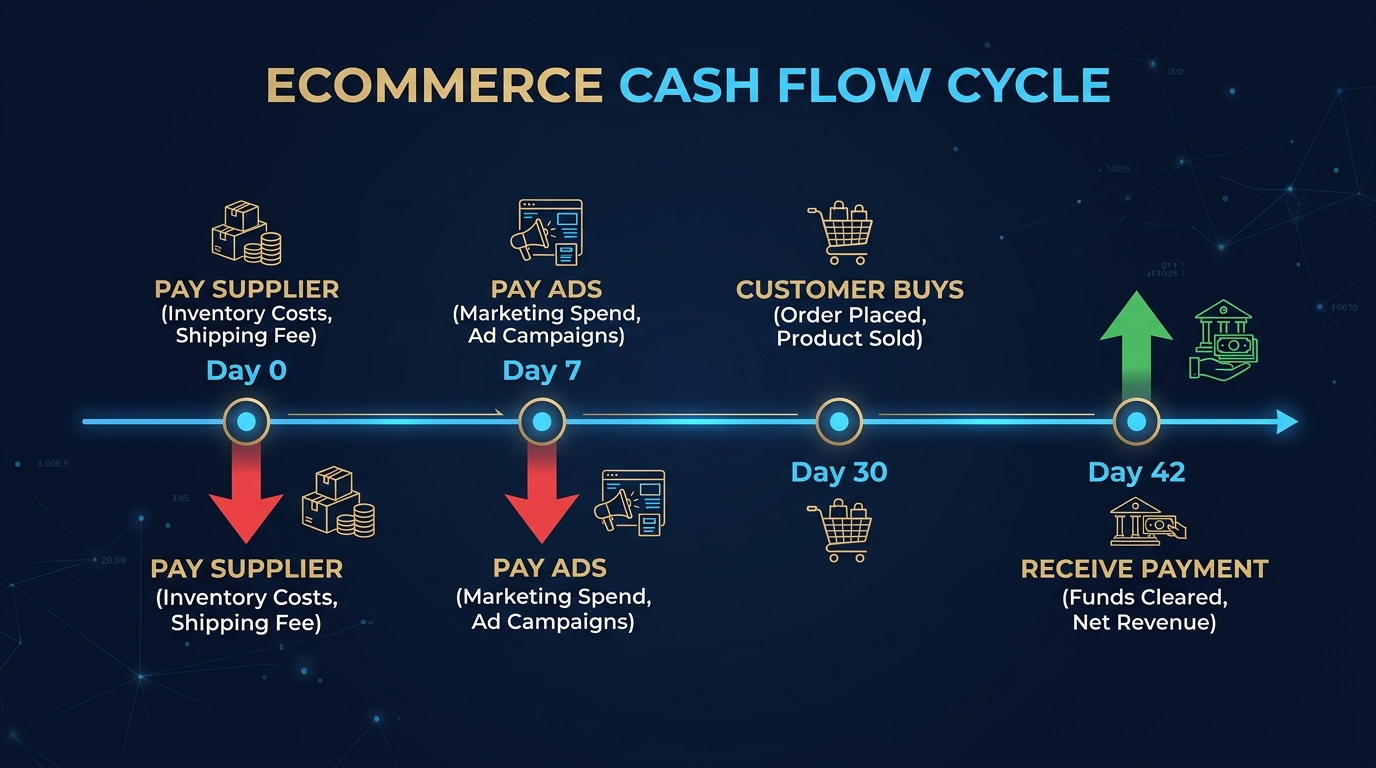
You pay for inventory on Day 0. You pay for ads on Day 7. The customer buys on Day 30. Shopify pays you on Day 42. Your net cash position is underwater for 42 days on every single sale.
Nguyen Tuan Dai
Founder & CEO, Okiela
Key Takeaways
- 1Cash goes out on Day 0 (supplier) and comes back on Day 35 (Shopify deposit) -- your money is underwater for 35+ days per order
- 2The Cash Conversion Cycle for average DTC brands is 25-35 days -- every day of growth widens the gap
- 3Growing 50% in revenue can put you $15,000 in the hole because inventory pre-investment outpaces incoming cash
- 4Three strategies to shorten the cycle: negotiate Net-30 supplier terms, reduce inventory days, accelerate Shopify payouts
- 5Weekly cash pulse check (bank balance + expected deposits - bills due) catches problems before the P&L does
Table of Contents (7 sections)
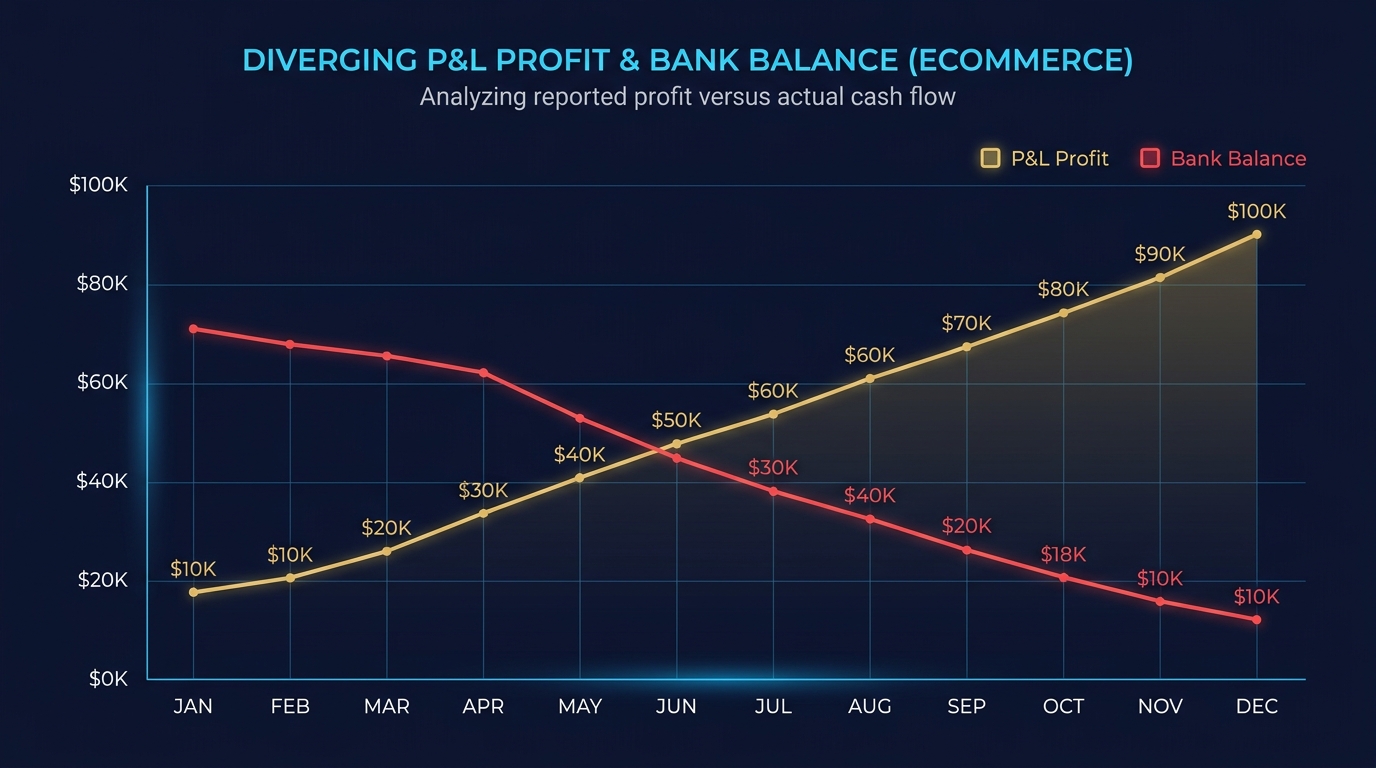
Every ecommerce transaction has a hidden timeline. Money goes out long before it comes back in. Understanding this timeline is the difference between scaling confidently and accidentally running out of cash during a growth month.
The irony of ecommerce: the faster you grow, the more cash you burn. Because every new order requires inventory that you purchased weeks ago.
The Cash Conversion Cycle
In corporate finance, there is a metric called the Cash Conversion Cycle (CCC). It measures how long it takes to convert a dollar invested in inventory into a dollar collected from a customer.
CCC = Days Inventory Outstanding + Days Sales Outstanding - Days Payable Outstanding
For a typical Shopify DTC brand:
| Metric | Days | What It Means |
|---|---|---|
| Days Inventory Outstanding (DIO) | 30-60 | How long inventory sits before selling |
| Days Sales Outstanding (DSO) | 2-14 | How long after a sale until Shopify deposits cash |
| Days Payable Outstanding (DPO) | 0-30 | How long until you pay suppliers |
| Cash Conversion Cycle | 2-44 days | How long your cash is tied up |
The "best case" CCC is 2 days (you sell fast, get paid fast, pay suppliers on credit). The average for DTC brands is 25-35 days. For brands with slow-moving inventory or long supplier terms, it can exceed 60 days.
Day-by-Day: The Life of a $60 Order
Let us trace the cash journey of a single $60 order for a product that costs $18 to make and ship:
Day 0 — You Pay the Supplier
You wire $18 to your manufacturer for this unit. The cash leaves your account immediately. The product will arrive at your warehouse in 2-4 weeks. (Many suppliers require payment on order, not on delivery.)
Day 14 — Product Arrives at Warehouse
The product sits on the shelf. Your $18 is now tied up in physical inventory. On the P&L, this does not show up as an expense yet — COGS only gets recorded when the item sells.
Day 21 — You Run Ads
You spend $8 on Facebook and Google Ads to get this customer. The ad spend hits your credit card balance. You will not pay the credit card for another 30 days, but the commitment is made.
Day 30 — Customer Buys
The customer pays $60. Your P&L immediately records $60 in revenue. But Shopify does not deposit this money into your bank account immediately.
Day 32 — Shopify Initiates Deposit
Shopify Payments batches your sales and initiates a transfer. Standard processing is 1-3 business days from the sale.
Day 35 — Cash Arrives in Bank
The $60 deposit lands in your checking account. This is Day 35 — a full 35 days after you paid the supplier.
Day 51 — Credit Card Bill Due
Your Facebook ad spend credit card statement arrives. You pay the $8 in ad costs that generated this sale.
The Cash Timeline Summary:
| Day | Event | Cash Impact |
|---|---|---|
| 0 | Pay supplier | -$18 |
| 21 | Run ads (credit card) | -$8 (committed) |
| 30 | Customer buys | $0 (recorded, not received) |
| 35 | Shopify deposits | +$60 |
| 51 | Pay credit card | -$8 (actual payment) |
| Net | After full cycle | +$34 |
You invested $26 ($18 inventory + $8 ads) and got back $60, netting $34 before other fees. But your cash was underwater from Day 0 to Day 35.
Multiply this by 500 orders/month. That is $9,000 in inventory cash ($18 × 500) tied up at any given time, plus whatever ads you are running for next month's customers.
Why Growth Kills Cash
Here is the counterintuitive math that destroys growing ecommerce brands:
Month 1: 500 orders/month. Inventory investment: $9,000. Monthly profit: $7,000.
Month 2: Growth! 750 orders/month. You need $13,500 in inventory (750 × $18). But you also need to stock up for Month 3, which you project at 1,000 orders. So you order $18,000 in inventory.
Cash position in Month 2:
- Profit from Month 1 sales: +$7,000
- Inventory for Months 2-3: -$18,000
- Ad spend increase (50% more): -$4,000
- Net cash: -$15,000
You grew 50%. Your profit grew. And you are $15,000 in the hole.
This is not a failure. This is the cash conversion cycle in action during a growth phase. Every unit of growth requires pre-investment in inventory that does not convert to cash until 30-45 days later.
The faster you grow, the wider the gap.
How Different Business Models Affect the Cycle
Not all ecommerce cash cycles are equal:
Print-on-Demand / Dropshipping
- DIO: 0 days (no inventory held)
- CCC: 2-14 days (just Shopify deposit delay)
- Cash impact: Very low. You only pay suppliers after a sale.
Made-to-Order
- DIO: 5-15 days (short production cycles)
- CCC: 7-29 days
- Cash impact: Moderate. Materials purchased before sale, but no dead stock risk.
Traditional Wholesale/Retail
- DIO: 30-90 days (bulk orders, seasonal stock)
- CCC: 32-104 days
- Cash impact: High. Months of cash tied up in inventory.
Subscription/Consumable
- DIO: 15-30 days
- CCC: 17-44 days, BUT recurring revenue smooths it
- Cash impact: Moderate, but predictable. Monthly auto-charges reduce DSO variance.
3 Strategies to Shorten the Cycle
1. Negotiate Supplier Payment Terms
Instead of paying on order (Day 0), negotiate Net-30 or Net-60 terms. This shifts your DPO from 0 to 30-60 days, dramatically improving your CCC.
Going from Net-0 to Net-30 on $18,000/month in COGS frees up $18,000 in working capital immediately.
Most suppliers will offer terms after 3-6 months of consistent orders. Start asking.
2. Reduce Inventory Days
Use sell-through data to order closer to actual demand. If your average product sits 45 days before selling, can you get it to 30?
Every 15 days of reduction on $30,000 inventory frees up approximately $10,000 in cash.
Pre-orders, just-in-time ordering, and smaller more frequent production runs all reduce DIO.
3. Accelerate Collections
Switch to faster payment processing. Shopify Payments with daily payouts (available at higher volumes) reduces DSO from 14 days to 1-2 days.
For stores on hold: maintain low chargeback rates (below 0.5%), process refunds quickly, and keep your account in good standing.
The Weekly Cash Pulse Check
Instead of looking at your P&L monthly, check your cash position weekly:
- 1Opening bank balance (Monday morning)
- 2Expected Shopify deposits this week
- 3Bills due this week (supplier invoices, ad spend, subscriptions)
- 4Closing projected balance (Friday)
If Friday's projected balance is below two weeks of operating expenses, you have a cash problem — regardless of what your P&L says about profit.
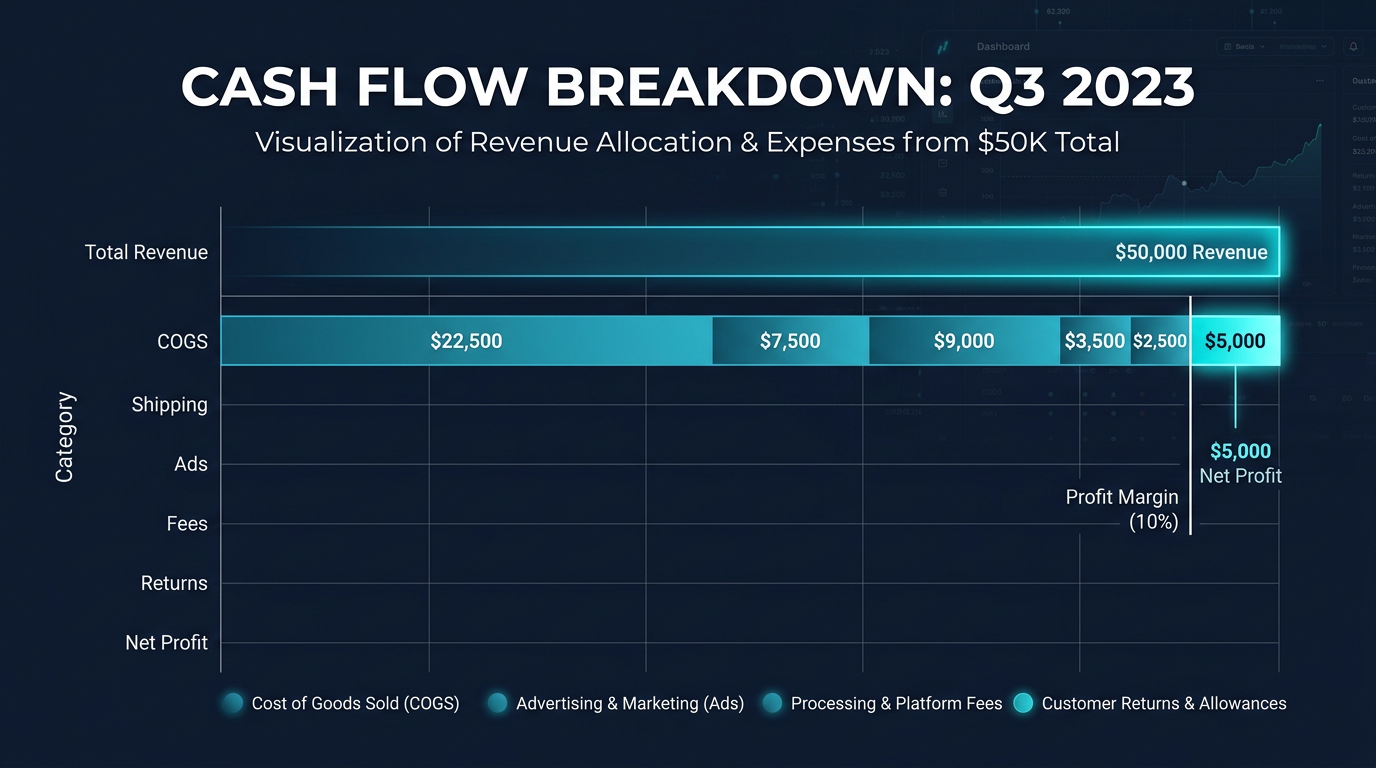
What Okiela Shows You
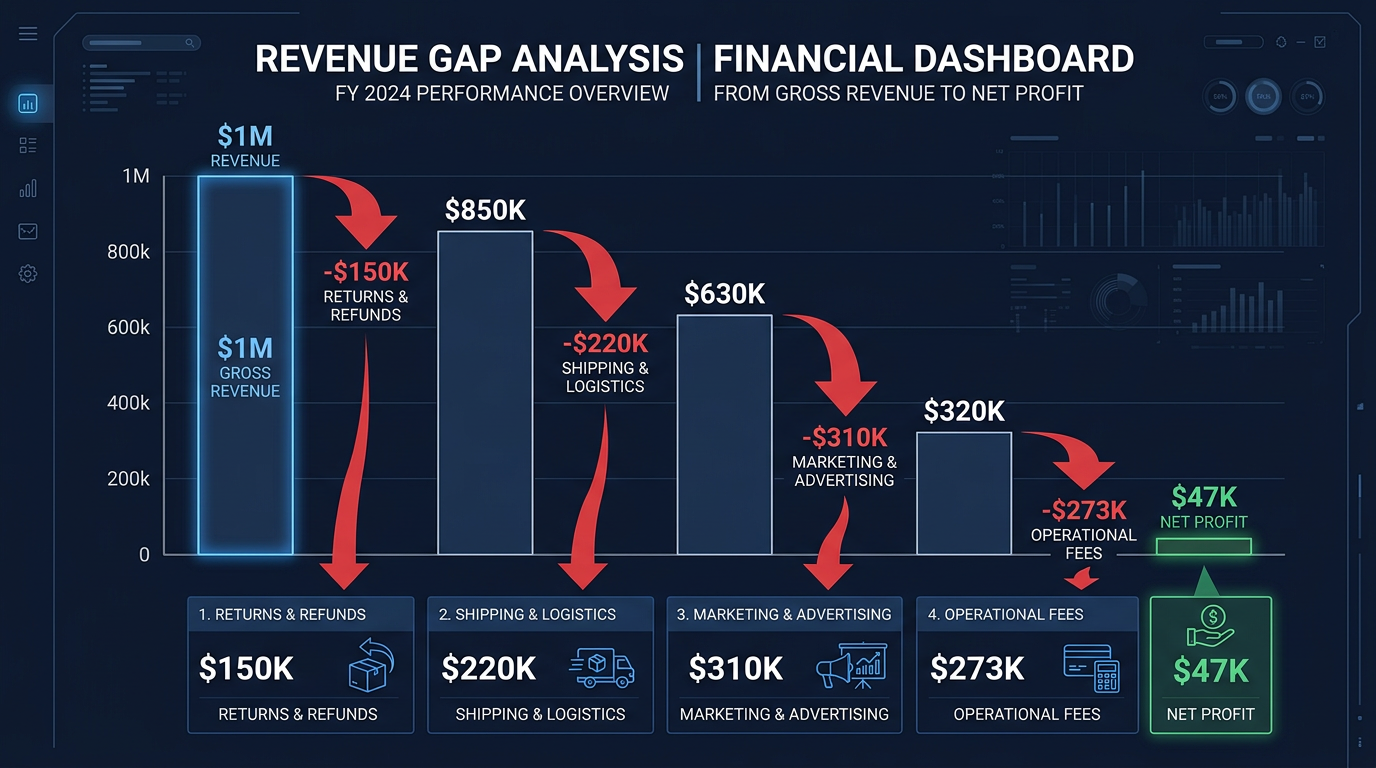
When you upload your Shopify export to Okiela, the 5-level profit waterfall shows exactly where cash gets consumed on the way from GMV to True Profit.
The per-SKU analysis reveals which products have the highest contribution margin — meaning they generate the most cash per unit after all variable costs. These are the products to stock more of. Products with low contribution margin tie up inventory cash for small returns.
The data quality score shows whether your COGS data is complete, estimated, or benchmarked — so you know how much to trust the cash flow implications.
Upload your Shopify data for free (3 analyses/month). Map the cash journey of every product in your store. The timeline always has more surprises than founders expect.
Find the hidden profit leaks draining your store.
Send one order export. Get your 3 biggest profit leaks back within 48 hours.
Request a free Profit Leakage AuditFree, founder-run, no pitch unless you ask. Every number labeled Verified or Estimated. Remove customer PII before upload.
Enjoyed this article?
Get weekly profit optimization tips and Okiela product news delivered to your inbox.
No spam. Unsubscribe anytime.
Nguyen Tuan Dai
Founder & CEO, Okiela
FP&A analyst building ecommerce tools on the side. Helping founders see their real numbers since 2025.