How Inventory Quietly Kills Your Profit (Even When Sales Look Great)
You have $40K in inventory. Sales are growing. But $15K of that inventory has not moved in 90 days. It is costing you $375/month just to store it — and the real cost is much higher.
Nguyen Tuan Dai
Founder & CEO, Okiela
Key Takeaways
- 1Total carrying cost of inventory is 20-30% of its value per year -- $40K in inventory costs $8K-$12K annually just to hold
- 2Dead stock (unsold 90+ days) typically represents 15-25% of ecommerce inventory and compounds monthly carrying costs
- 3ROII (Return on Inventory Investment) should exceed 100% annually -- anything below means your money works harder in a savings account
- 4The MOQ trap makes you think bulk buying saves money, but carrying cost often exceeds the per-unit discount within 3-6 months
- 5Monthly inventory audit: categorize A-D tier by velocity, calculate per-SKU ROII, set markdown triggers before carrying cost exceeds profit
Table of Contents (5 sections)
Inventory is the silent profit killer in ecommerce. It does not show up as a dramatic loss on your P&L. It drains your business slowly — through carrying costs, depreciation, opportunity cost, and eventual markdowns.
A 2025 IHL Group study found that overstocking costs retailers $562 billion globally per year. The average ecommerce brand writes off 3-5% of inventory annually. For a store carrying $50,000 in inventory, that is $1,500-$2,500 in product that goes straight to the dumpster or gets sold at a loss.
But the real cost of inventory goes far beyond write-offs.
The True Cost of Holding Inventory
Most founders think inventory cost = what you paid the supplier. That is just the beginning.
The total cost of holding inventory includes:
1. Capital Cost (Opportunity Cost)
Every dollar in inventory is a dollar NOT in your bank account. If you have $40,000 in inventory and could earn 5-8% annual return on that capital elsewhere, your opportunity cost is $2,000-$3,200/year.
More realistically: that $40,000 could fund 4 months of ad spend at $10K/month, which might generate $80K-$120K in revenue. The opportunity cost of dead inventory is massive.
2. Storage Cost
3PL warehouses charge $15-$45 per pallet per month, or $0.50-$2.00 per cubic foot. For a store with 200 cubic feet of inventory:
- Low end: $100/month ($1,200/year)
- High end: $400/month ($4,800/year)
Even home-based fulfillment has costs: the spare bedroom or garage could be rented out, and your time managing inventory has a labor cost.
3. Insurance
Inventory insurance typically runs 0.5-1.5% of inventory value per year. On $40,000 in inventory, that is $200-$600/year.
4. Shrinkage (Theft, Damage, Administrative Errors)
The National Retail Federation reports average inventory shrinkage of 1.4% for retail businesses. On $40,000: approximately $560/year in inventory that simply disappears.
5. Obsolescence and Depreciation
Fashion and trend-driven products lose value quickly. An item that is "hot" in January might sell at 50% off by June. Seasonal items (holiday products, summer gear) depreciate to near-zero value off-season.
Even non-seasonal products have a shelf life. Electronics, beauty products, and food items have literal expiration dates.
Total Carrying Cost
Industry benchmarks put total carrying cost at 20-30% of inventory value per year.
| Carrying Cost Component | Annual % |
|---|---|
| Capital / opportunity cost | 8-15% |
| Storage | 3-8% |
| Insurance | 0.5-1.5% |
| Shrinkage | 1-2% |
| Obsolescence | 5-10% |
| Handling / labor | 2-5% |
| Total | 20-30% |
On $40,000 in inventory, that is $8,000-$12,000 per year in hidden costs — or $667-$1,000 per month — just to HOLD the inventory. Before you sell a single unit.
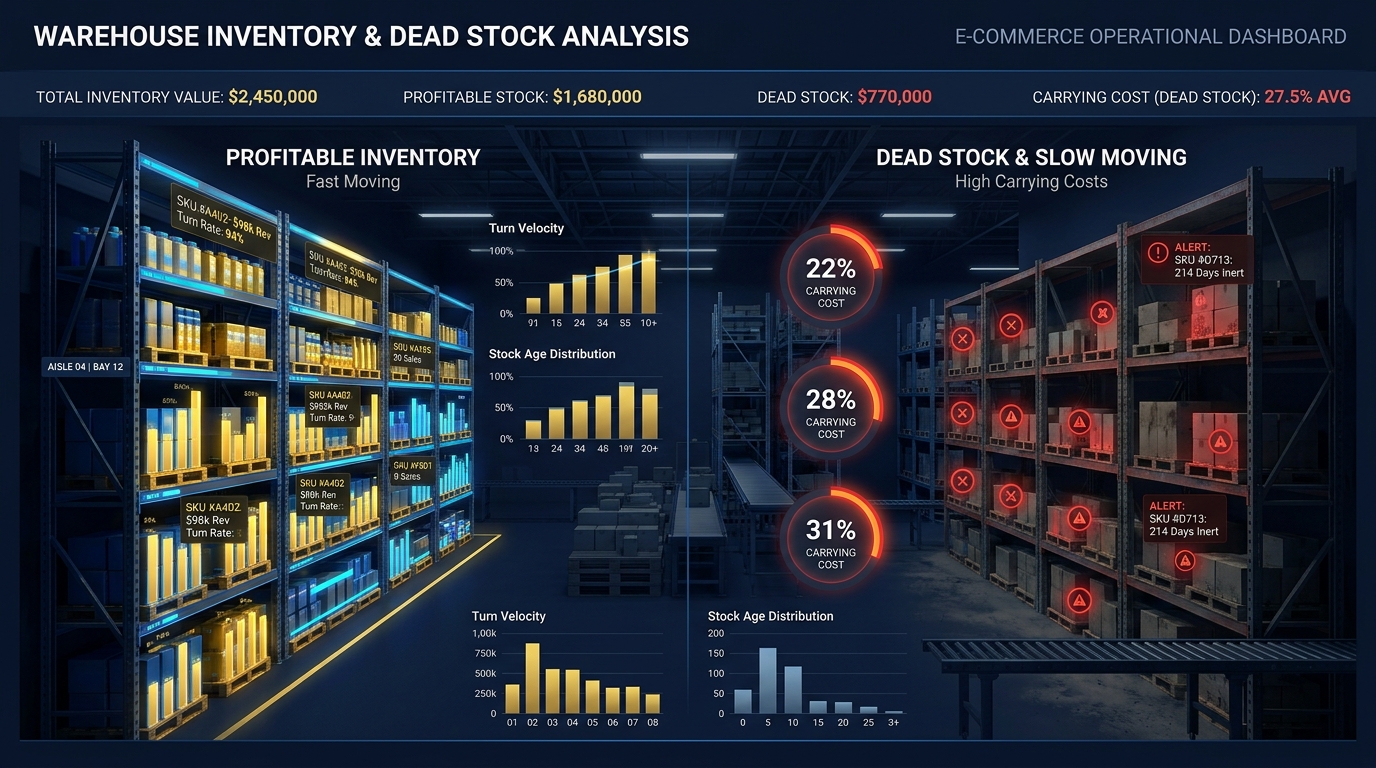
Dead Stock: The Quiet Profit Drain
Dead stock is inventory that has not sold in 90+ days. For the average ecommerce brand, 15-25% of inventory falls into this category.
Here is why it is so dangerous:
It compounds. A SKU that does not sell in 90 days is not suddenly going to start selling. Each month, carrying costs accumulate. After 6 months, you have spent 10-15% of the original cost just on storage and opportunity.
It masks real performance. If your total inventory is $40,000 but $10,000 is dead, your "active" inventory (the stuff actually making money) is $30,000. Your inventory turnover rate, ROI on inventory, and working capital efficiency are all worse than they appear.
It forces markdowns. Eventually, you have to clear dead stock at 30-70% off. These markdowns destroy margin and train customers to wait for sales.
The Inventory Audit Every Store Needs
Run this audit on your inventory every month:
Step 1: Categorize by Velocity
| Category | Sold in Last... | Action |
|---|---|---|
| A-tier (fast movers) | 30 days | Keep stocked, possibly increase order |
| B-tier (steady sellers) | 31-60 days | Monitor, maintain current levels |
| C-tier (slow movers) | 61-90 days | Reduce reorder quantity, consider promos |
| D-tier (dead stock) | 90+ days | Liquidate, bundle, donate, or destroy |
Step 2: Calculate Each SKU's Return on Inventory Investment
ROII = Annual Profit from SKU / Average Inventory Cost of SKU
A SKU that generates $5,000/year in profit on $2,000 average inventory has a 250% ROII.
A SKU that generates $500/year on $3,000 average inventory has a 16.7% ROII — you would literally be better off putting the $3,000 in a savings account.
Step 3: Identify the Markdown Trigger Point
For each slow-moving SKU, calculate when it is cheaper to liquidate than to hold:
Markdown Trigger = Carrying Cost per Month > Gross Profit if Sold at Full Price / Remaining Expected Months to Sell
If carrying cost is $50/month and you expect to sell 1 unit/month at $30 profit, you are losing $20/month by holding it. Markdown now.
Common Inventory Traps
The MOQ Trap
Minimum Order Quantities (MOQs) from suppliers force you to buy more than you need. If your supplier requires 500 units but you sell 50/month, you now have 10 months of inventory. The $5,000 you "saved" per unit by meeting the MOQ now costs you $1,000-$1,500/year in carrying costs.
Consider whether paying a higher per-unit cost for smaller orders is actually cheaper when carrying costs are included.
The "New Launch" Trap
Excitement about new products leads to overordering. A new SKU should start with 2-4 weeks of projected demand, not 3-6 months. It is cheaper to reorder quickly (even paying for rush shipping) than to sit on slow-moving new inventory.
The "Discount Season" Trap
Ordering extra inventory for Black Friday or a flash sale often results in a spike of post-sale dead stock. If you order 2,000 units for a sale and sell 1,200, the remaining 800 units become your most expensive inventory — purchased at bulk price but requiring months of carrying costs plus eventual markdowns.
What Okiela Shows You
When you upload your Shopify export to Okiela, the per-SKU profitability analysis reveals which products contribute the most to your true profit — and which are dragging it down.
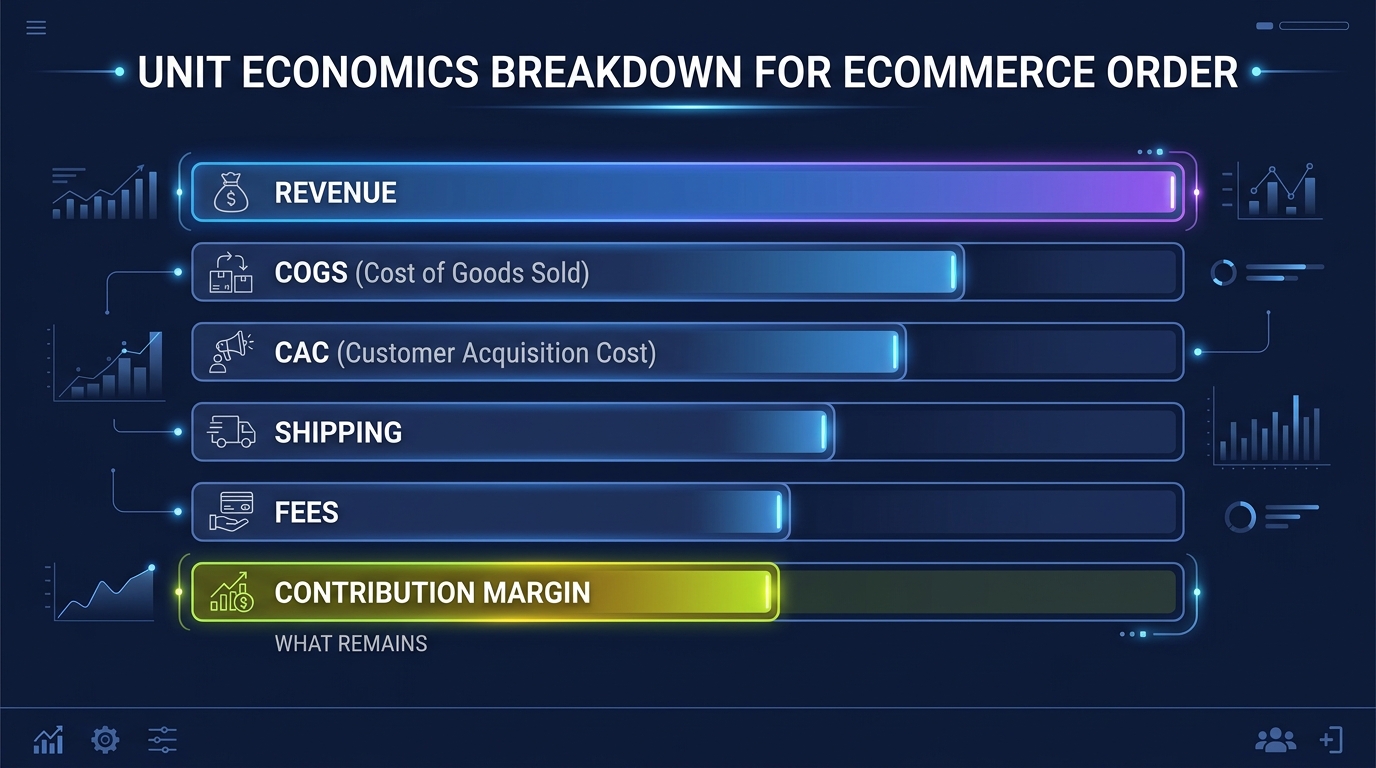
The contribution margin per SKU shows whether each product covers not just COGS but also its share of variable costs (shipping, fees, returns). If a SKU's contribution margin is negative, every unit you sell of it costs you money.
Combined with the profit waterfall (L1→L5), you can see exactly how much of your revenue leaks to each cost category — and whether your inventory investment is proportional to the profit each product generates.
Upload your Shopify data for free (3 analyses/month). Find out which products deserve more shelf space and which are silently eating your cash. The answer is usually surprising.
Find the hidden profit leaks draining your store.
Send one order export. Get your 3 biggest profit leaks back within 48 hours.
Request a free Profit Leakage AuditFree, founder-run, no pitch unless you ask. Every number labeled Verified or Estimated. Remove customer PII before upload.
Enjoyed this article?
Get weekly profit optimization tips and Okiela product news delivered to your inbox.
No spam. Unsubscribe anytime.
Nguyen Tuan Dai
Founder & CEO, Okiela
FP&A analyst building ecommerce tools on the side. Helping founders see their real numbers since 2025.
Related Articles
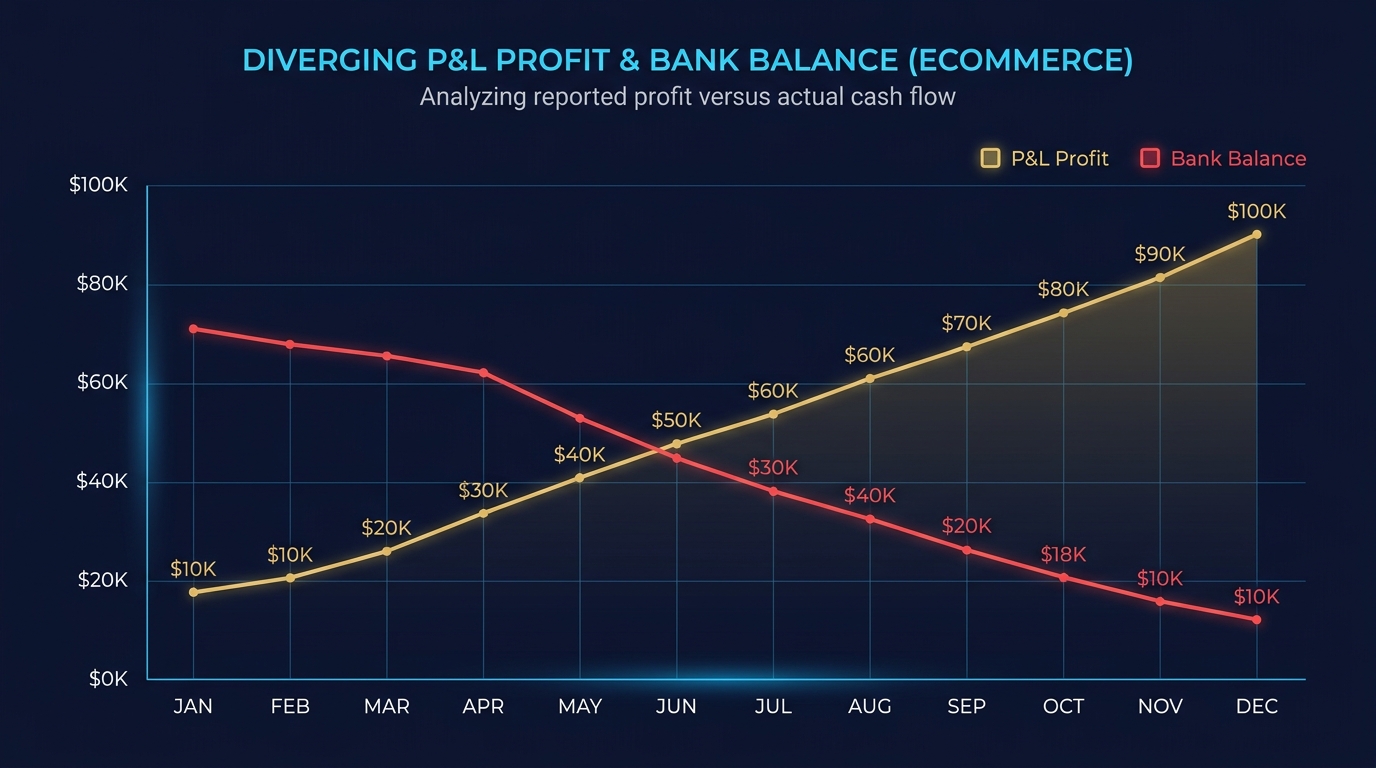
Why Profit Is Not the Same as Cashflow (The #1 Mistake Killing Ecommerce Stores)
13 min read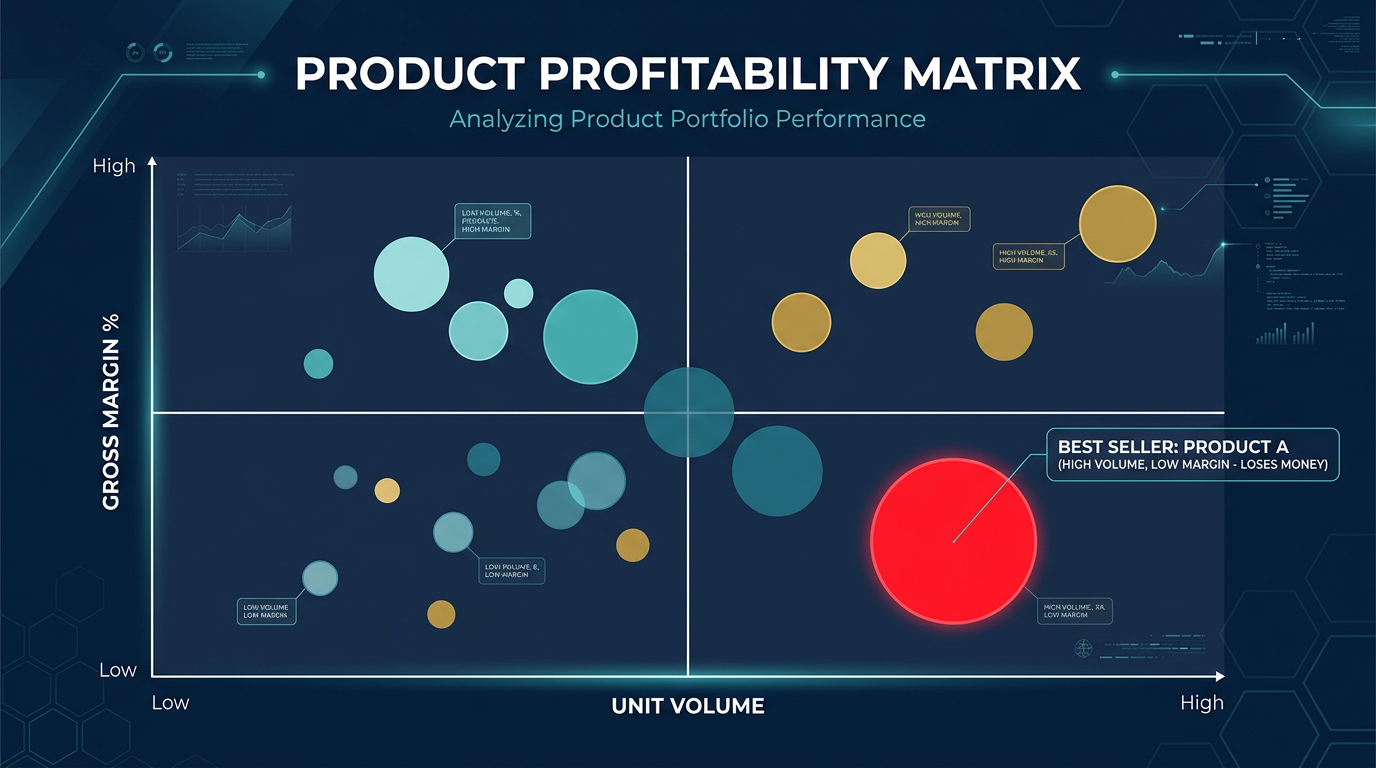
Your Best-Selling Product Might Be Your Biggest Profit Killer (How to Check)
10 min read