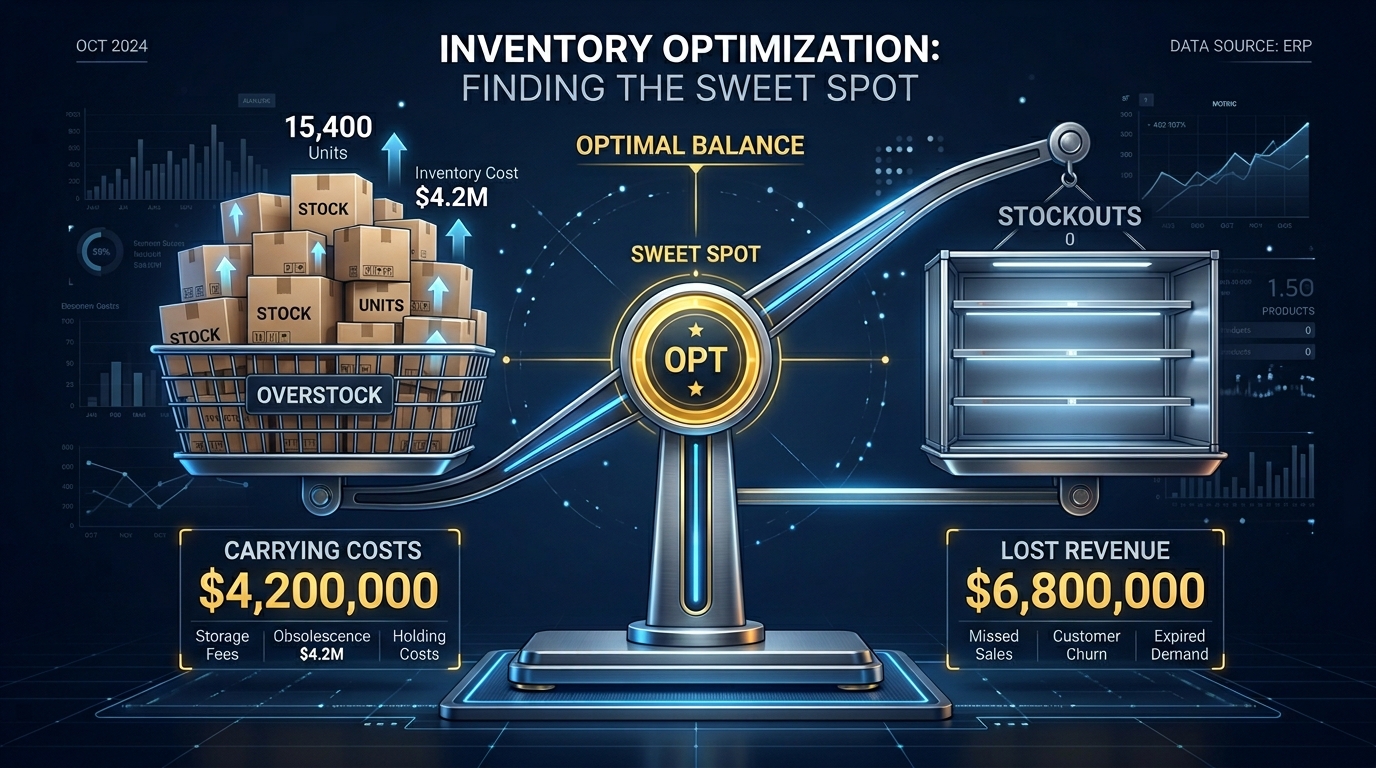
Overstock vs Stockout: Both Are Killing Your Profit (Here Is the Real Cost of Each)
Overstock ties up $8K-$12K/year in carrying costs per $40K inventory. Stockouts lose you $2,000-$5,000/month in missed revenue. Neither is acceptable. Here is how to find the sweet spot.
Nguyen Tuan Dai
Founder & CEO, Okiela
Key Takeaways
- 1Overstocking $10K in inventory costs $7,500 total (carrying + markdown) -- but stockout on a fast-selling SKU for 10 days costs $7K-$10K+ in lost revenue and customer LTV
- 2For top-selling A-SKUs, overstock by 2-4 weeks is dramatically cheaper than running out -- carry cost of $47/month vs $5K+ in lost sales
- 3Reorder point formula: (Daily Sales x Lead Time) + Safety Stock -- prevents both overstocking and stockouts with math instead of gut feeling
- 4ABC analysis: top 20% of SKUs generate 80% of revenue -- concentrate inventory investment there, go lean on the bottom 50%
- 5For slow-moving C-SKUs, a stockout is acceptable -- the carrying cost of overstocking exceeds the lost revenue from missed sales
Table of Contents (6 sections)
Every ecommerce founder faces the same inventory dilemma: order too much and you tie up cash. Order too little and you miss sales.
Both mistakes cost real money. But most founders do not know exactly how much each one costs — so they make decisions based on gut feeling instead of math.
Let us put actual numbers on both sides.
The Cost of Overstocking
Overstocking means holding more inventory than you can sell in a reasonable timeframe (typically 60-90 days for most ecommerce products).
Direct Costs
Using the 20-30% annual carrying cost benchmark from industry research:
| Overstock Amount | Annual Carrying Cost (25% avg) | Monthly Cost |
|---|---|---|
| $5,000 excess | $1,250/year | $104/month |
| $10,000 excess | $2,500/year | $208/month |
| $20,000 excess | $5,000/year | $417/month |
| $50,000 excess | $12,500/year | $1,042/month |
That is the cost of simply HOLDING the excess inventory. It does not include the eventual markdown loss when you have to clear it.
Markdown Cost
When overstock eventually gets liquidated:
- Flash sale: 20-40% off (you keep 60-80% of retail)
- End-of-season clearance: 40-70% off (you keep 30-60%)
- Wholesale liquidation: 70-90% off (you keep 10-30%)
- Donation / disposal: 100% loss (but potential tax deduction)
On $10,000 in overstock, a typical clearance sale at 50% off recovers $5,000. The other $5,000 is gone — plus the $2,500 in carrying costs you already paid. Total cost of overstock: $7,500 on $10,000 worth of products.
Opportunity Cost
The cash tied up in overstock could have funded:
- Ad spend generating 3-5x ROAS ($30,000-$50,000 in revenue from $10,000)
- New product development (test 5 new products at $2,000 each)
- Faster shipping options (increasing conversion rate by 5-10%)
This is the invisible cost that never shows up on any P&L.
The Cost of Stockouts
A stockout occurs when a customer wants to buy your product but it is out of stock. The costs are different from overstocking — less visible but equally damaging.
Lost Revenue
This is the most obvious cost. If your top-selling product (AOV: $65) goes out of stock for 10 days and normally sells 8 units/day:
Lost revenue = 10 days × 8 units × $65 = $5,200
At a 40% profit margin, that is $2,080 in lost profit — real money you cannot recover.
Lost Ad Spend
If you are running ads to a product page and the product goes out of stock, every click is wasted money.
At $2.50 CPC with 100 clicks/day to an out-of-stock page for 5 days:
Wasted ad spend = 5 × 100 × $2.50 = $1,250
You pay for the traffic. The customer gets nothing. You get nothing.
Customer Lifetime Value Loss
A customer who encounters a stockout:
- 31% will go to a competitor (IHL Group research)
- 21% will never return to your store
- 9% will not buy the alternative you suggest
That one stockout event does not just lose you one sale — it potentially loses you an entire customer relationship worth $200-$500 in lifetime value.
Search Ranking Damage
If your product page goes out of stock for an extended period:
- Shopify may mark it as "sold out" in structured data
- Google Shopping delists out-of-stock products immediately
- Organic ranking can drop if pages return 404 or show sold-out
- Competitors fill the gap in Shopping ads and organic results
Rebuilding search position after a stockout can take 2-4 weeks of ad spend and sales velocity.
Amazon-Specific: BSR Destruction
For sellers on Amazon, a stockout kills your Best Sellers Rank (BSR). It takes 2-4 weeks of aggressive promotions (often at a loss) to recover a BSR that dropped due to a 5-day stockout. The cost of BSR recovery frequently exceeds the carrying cost you were trying to avoid.
Comparing the Two
| Factor | Overstock Cost | Stockout Cost |
|---|---|---|
| Direct financial | 25% carrying cost/year | Lost revenue + wasted ad spend |
| Timing | Slow drain over months | Immediate impact in days |
| Reversibility | Can liquidate (at a loss) | Lost sales cannot be recovered |
| Customer impact | None (product available) | High (leaves for competitor) |
| Brand impact | None | Negative (unreliable impression) |
| Recovery time | Sell through over weeks | 2-4 weeks to regain ranking |
Here is the uncomfortable truth: for most fast-selling SKUs, the cost of a stockout exceeds the cost of overstock.
On a $65 AOV product selling 8/day:
- Stockout for 10 days = $5,200 lost revenue + $1,250 wasted ads + customer LTV loss = $7,000-$10,000+
- Overstocking by 2 weeks of extra supply (112 units × $20 COGS = $2,240) costs $560/year in carrying cost = $47/month
Overstocking your top sellers by 2 weeks is dramatically cheaper than running out.
The calculation reverses for slow-moving SKUs. A product that sells 2 units/week should not carry 3 months of supply.
The Reorder Point Formula
The reorder point tells you exactly when to place a new order:
Reorder Point = (Average Daily Sales × Lead Time in Days) + Safety Stock
Where:
Safety Stock = Z-score × Standard Deviation of Daily Sales × Square Root of Lead Time
In plain English:
- 1Figure out how many you sell per day on average
- 2Multiply by how long it takes to get new inventory from your supplier
- 3Add a buffer (safety stock) for demand variability
Example
- Average daily sales: 8 units
- Supplier lead time: 14 days
- Daily sales standard deviation: 3 units
- Desired service level: 95% (Z-score = 1.65)
Reorder Point = (8 × 14) + (1.65 × 3 × √14) = 112 + 18.5 ≈ 131 units
When inventory drops to 131 units, place a new order. This gives you enough stock to cover the 14-day lead time plus a 95% buffer for demand spikes.
The ABC Approach to Inventory Allocation
Not all SKUs deserve the same inventory investment:
A-SKUs (Top 20% by Revenue)
- These typically generate 70-80% of revenue
- Strategy: Never stockout. Maintain 3-4 weeks of safety stock.
- Acceptable overstock: Yes, up to 4-6 weeks of supply
- Reorder frequency: Weekly review
B-SKUs (Middle 30% by Revenue)
- Generate 15-20% of revenue
- Strategy: Maintain 2-3 weeks of safety stock
- Acceptable overstock: 2-4 weeks
- Reorder frequency: Bi-weekly review
C-SKUs (Bottom 50% by Revenue)
- Generate only 5-10% of revenue
- Strategy: Lean inventory. Stockouts are acceptable.
- Acceptable overstock: Never more than 2 weeks
- Reorder frequency: Monthly review
This approach concentrates your inventory cash on the products that actually make money, while keeping minimal investment in slow movers.
What Okiela Shows You
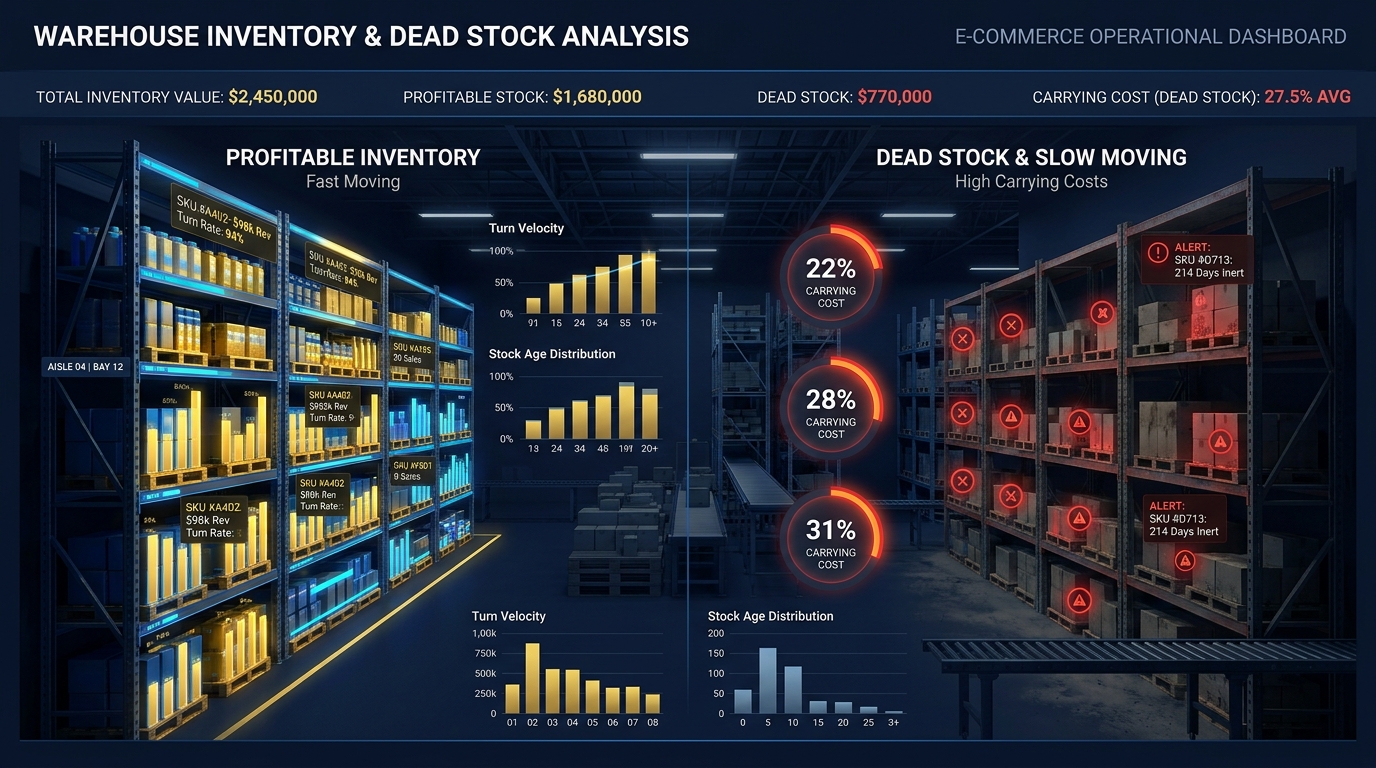
When you upload your Shopify export to Okiela, the per-SKU profit analysis shows which products generate the highest contribution margin. Combined with sales velocity from your export data, you can identify:
- A-SKUs to never let stock out (high profit contribution, high velocity)
- C-SKUs to minimize inventory for (low profit, low velocity)
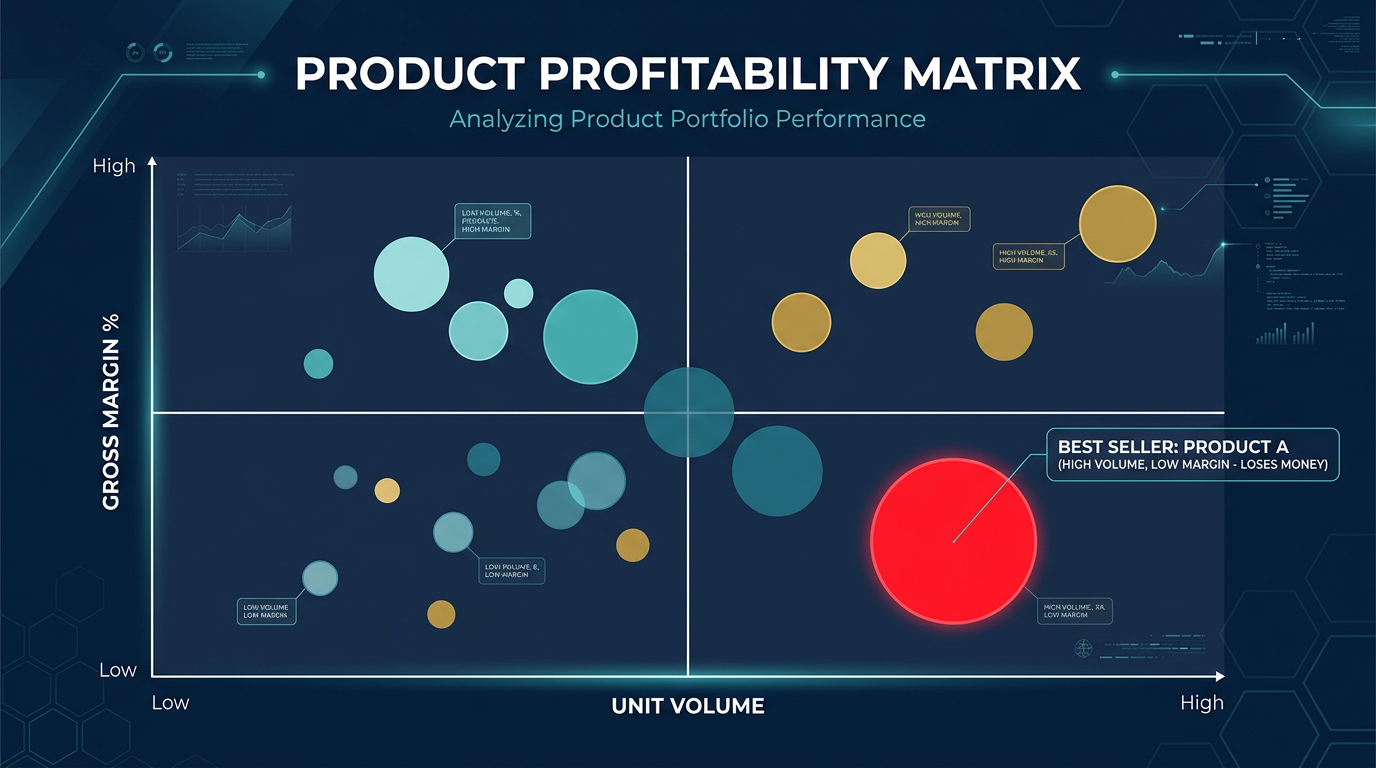
- Danger SKUs that look like top sellers by revenue but have negative or near-zero contribution margin (high revenue, high costs)
The profit waterfall (L1→L5) reveals how much total cash goes to COGS versus other costs — helping you decide whether inventory investment is your biggest cash drain or whether ads, shipping, or returns deserve more attention.
Upload your Shopify data for free (3 analyses/month). Find out which products deserve your inventory investment and which are silently tying up your cash.
Find the hidden profit leaks draining your store.
Send one order export. Get your 3 biggest profit leaks back within 48 hours.
Request a free Profit Leakage AuditFree, founder-run, no pitch unless you ask. Every number labeled Verified or Estimated. Remove customer PII before upload.
Enjoyed this article?
Get weekly profit optimization tips and Okiela product news delivered to your inbox.
No spam. Unsubscribe anytime.
Nguyen Tuan Dai
Founder & CEO, Okiela
FP&A analyst building ecommerce tools on the side. Helping founders see their real numbers since 2025.